Skip to content / Đến nội dung
ThichHocToan.com

Question bank IMSO Science 2022

Exam papers

54 questions

Question 1

A bakery sells bread for \(5\) dollars a piece in the morning, but sells them at a 20% discount during the afternoon. The owner of the bakery noticed that the amount of breads sold in the afternoon increases by 350% compared to the morning and that the total revenue for the whole day is \(4646\) dollars. How many breads does the bakery sell for the whole day?

Question 2

John has a 24-hour digital clock which shows the time from 00:00 to 23:59 each day. How many times in a day is the sum of the digits of the current hour equal to the sum of the digits of the current minute? (An example is 12:30, where the sum of the digits of the current hour: 1 + 2 = 3 is equal to the sum of the digits of the current minute: 3 + 0 = 3.)

Question 3

Let N be the largest 2022-digit number that is a multiple of 81. What are the last two digits of N?

Question 4

How many ways can we put exactly one “+” sign and zero, one or several “×” signs inside the boxes of the following expression: $1\square 2\square 1\square 2\square 1$, such that the result is an odd number?

Question 5

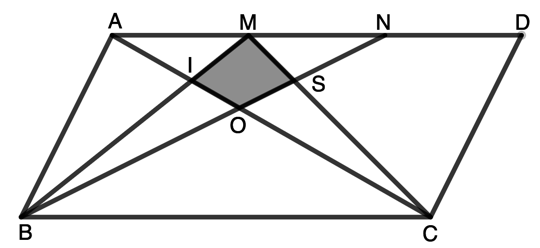
In the figure below, ABCD is a parallelogram that has an area of 600 cm2. The points M and N are on the line AD such that AM= MN= ND, the point O is the intersection of AC and BN , the point I is the intersection of AC and BM and the point S is the intersection of BN and CM . What is the area, in cm2, of quadrilateral IMSO?

Question illustration

Question 6

There are three problems in a mathematics contest. Students win gold, silver or bronze medals if they are able to solve 3, 2 or 1 problem(s) respectively. If each problem is solved by exactly 80 students and there are exactly 144 medalists, what is the positive difference between the number of gold and bronze medalists?

Question 7

Write the numbers 1, 2, 3, 4, 5, and 6 around a circle in clockwise direction. We always start by removing the number 1 and continue to do this process of removing the second remaining number, also in clockwise direction, until the last number remains. For example, Turn 1: Remove Number 1 Turn 2: Keep 2, Remove 3 Turn 3: Keep 4, Remove 5 Turn 4: Keep 6, Remove 2 Turn 5: Keep 4, Remove 6 So, the last remaining number is 4. If the numbers from 1 to 2022 are written on a circle in clockwise direction and the same process is applied, what will be the last number that remains?

Question 8

There are 25 oranges, having different sizes, which are placed on a 5 by 5 grid. First, we take the biggest orange from each of the rows. Thus, we now have 5 oranges, and then among them, we locate the smallest one among these 5 oranges and mark it as X. After which, we place these 5 oranges back into their original positions. Similarly, take the smallest orange from each of the columns. After doing this, we again have 5 oranges, and then among them, we locate the biggest one among these 5 oranges and mark it as Y. After which, we again place these 5 oranges back into their original positions. Is it possible to determine which orange is bigger, X or Y? Justify your answer.

Question 9

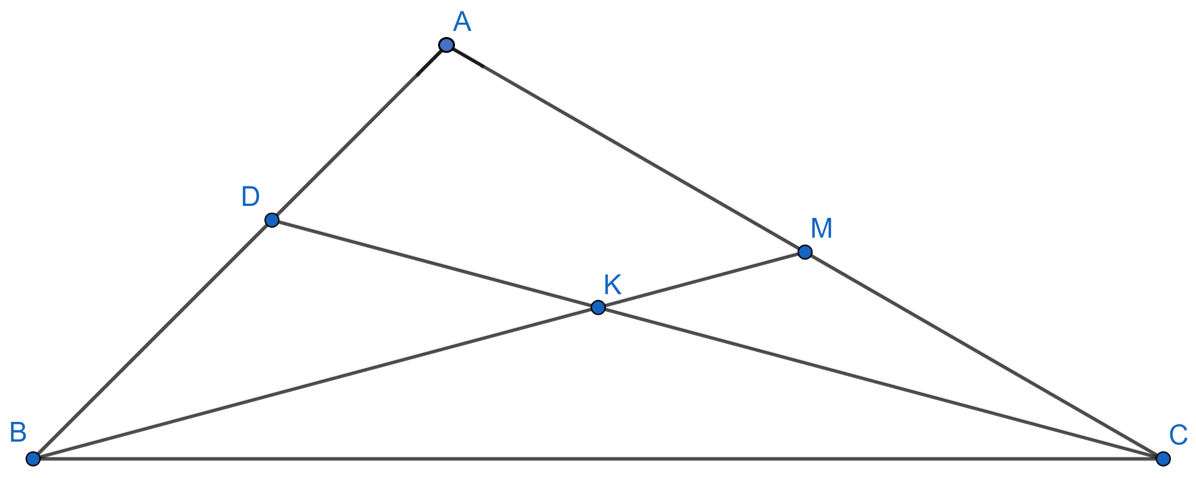
Given a triangle ABC with 105° <∠A < 115° . The median BM intersects the bisector CD at K. If KB = KC, list all possible value of the measure, in degrees, of ∠ABC +∠ACB?

Question illustration

Question 10

How many ways are there to select four distinct integers a, b, c and d from 1, 2, ... ,600 such that a, b, c and d forms a strictly increasing geometric sequence whose common ratio is positive integer? Note: Two examples of a geometric sequence are 1, 2, 4, 8, 16, ... having a common ratio of 2 and 2, 6, 18, 54, 162, ... having a common ratio of 3.

Question 11

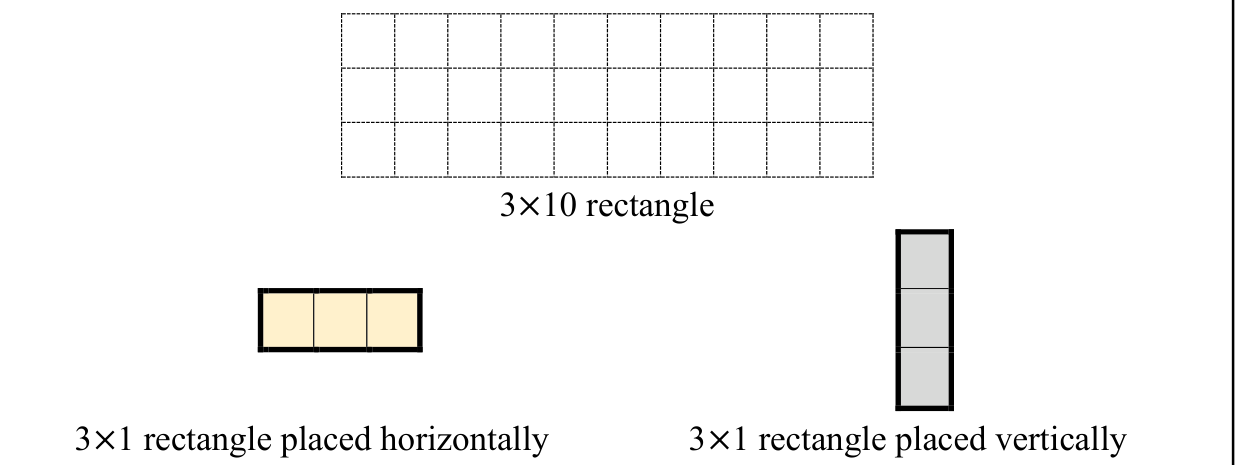
How many different arrangements are there to cover the 3 × 10 rectangle using ten 3 × 1 rectangles without overlapping? Note: Each 3 × 1 rectangle can be placed horizontally or vertically.

Question illustration

Question 12

A number is called “IMSO2” if it can be written as the sum of 2 consecutive positive integers. A number is called “IMSO3” if it can be written as the sum of 3 consecutive positive integers. A number is called “IMSO4” if it can be written as the sum of 4 consecutive positive integers. A number is called “IMSO5” if it can be written as the sum of 5 consecutive positive integers. For example, the number 15 is an IMSO2 because it can be written as 15 = 7 + 8. Moreover, 15 is also an IMSO3 because it can be written as 15 = 4 + 5 + 6. Furthermore, 15 is also an IMSO5 because it can be written as 15 = 1 + 2 + 3 + 4 + 5. However, 15 is not an IMSO4 because it cannot be written as the sum of 4 consecutive positive integers. From 1 to 2022, how many of them are IMSO2, IMSO3 and IMSO5 but not IMSO4 at the same time?

Question 13

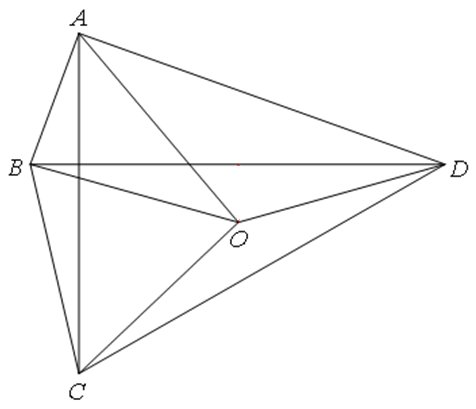
Let O be a point inside a convex quadrilateral ABCD with perpendicular diagonals such that OB= OD. If the area of the triangle ABC is 45 cm2, the area of the triangle AOD is 120 cm2, and the area of the triangle OCD is 60 cm2, then what is the area, in cm2, of the triangle AOC?

Question illustration

Question 1

IMSO 2022 · Indonesia · Science Experiment · 1 December 2022

2 experiments | 25 points | 150 minutes for the whole paper.

EXPERIMENT 1

The eruption of volcanoes and the formation of mountains are only two of the many wonders caused by plate tectonics. These brittle and rigid plates of massive proportions move independently because of the hot and soft solid rock layer beneath them. But, how exactly do they move, and what drives them?

Materials
- room temperature water
- hot water (about 70°C)
- towels for water spills
- food coloring in small containers
- basin or sink for used water
- plastic pan
- pipette or medicine dropper
- four foam cups
- one cup lid
- two sheets of white paper

Procedures

There are eight (8) videos that you can access through our examination portal. Two video clips for each Set-up: Top View and Side View. Download and view them chronologically (Setup A, Setup B, Setup C, and Setup D). Record your observations on the data tables provided.

Editorial availability notice: The supplied archive contains only three PDFs. This PDF has no hyperlinks, embedded video files or portal address. The eight required videos were not supplied or located in the source inventory. The diagrams below are blank observation templates, not video results. Obtain the original authorized videos before completing video-dependent observations; no substitute observations are provided.

Data Tables

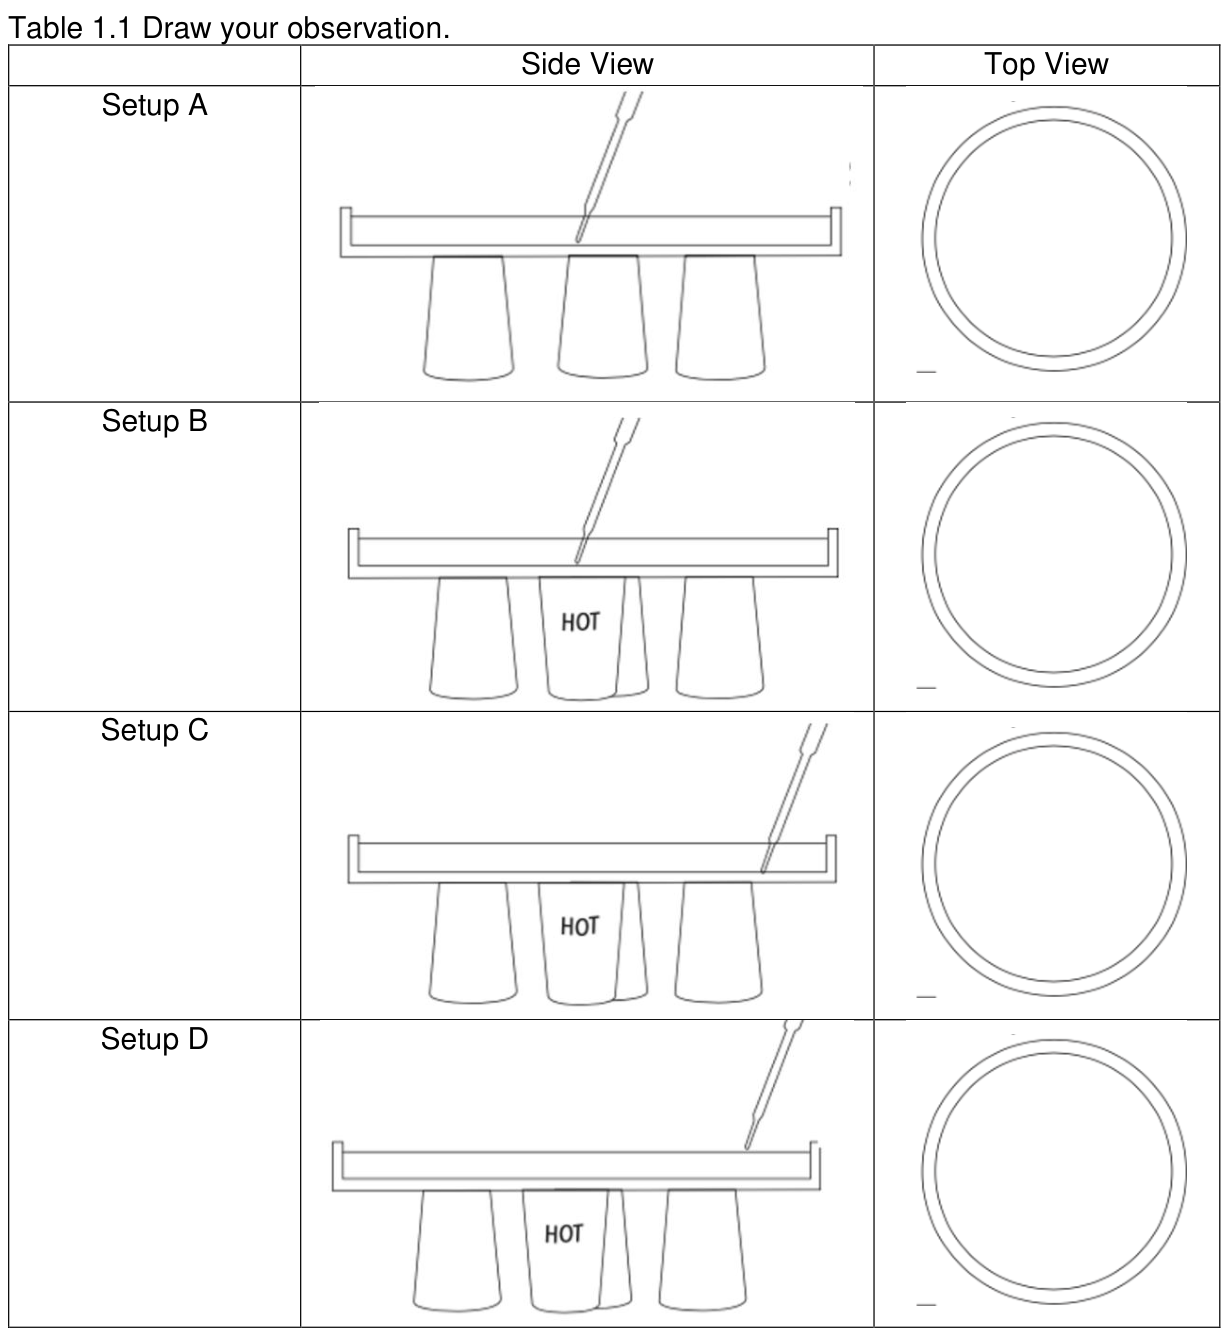
Table 1.1 Draw your observation.

Question illustration

Figure labels: Side View; Top View; Setup A; Setup B; Setup C; Setup D; HOT = hot-water cup. Draw the dye movement you actually observe on each blank view.

Table 1.2 Describe your observation.

| Setup | Observations |
| --- | --- |
| A | ____________________ |
| B | ____________________ |
| C | ____________________ |
| D | ____________________ |

Questions


1\. Refer to Table 1.2, compare your observations from Setup A to the other setups. What effect does the heat source have on Setups B-D?

2\. Describe the location in the pan where: (a) the current flowed toward the heat source and (b) where did it flow away from the heat source.

3\. Describe where in the pan was the food coloring (a) flowing upward and (b) where was it flowing downward?

4\. This experiment models one of the mechanisms geologists think might drive plate tectonics. In this model, what does the water represent? What does the hot water in the cup represent?

5\. In this model, nothing represents plates. To include them, what could you add and where should they be placed?

6\. Assuming that this model accurately represents Earth, explain how plates are moved about on Earth’s surface. Why do land masses or continents move when their underlying plates move?

7\. The currents in the water normally cause the food coloring to move at a rate of 2–3 cm or more per minute. How does this compare to the rate estimated for tectonic plate motion?

Question 2

IMSO 2022 · Indonesia · Science Experiment · 1 December 2022

2 experiments | 25 points | 150 minutes for the whole paper.

EXPERIMENT 2

Candy Chromatography: What Makes Those Colours?

Introduction

Almost all substances we come into contact with on a daily basis are impure; that is, they are mixtures. Similarly, compounds synthesized in the chemical laboratory are rarely produced pure.

Chromatography is first devised by Mikhail Tsivet in 1900 and is used to separate compounds within a mixture. This separation technique assumes a significant part in the medical and food industries.

In the battle against the Covid-19 pandemic, chromatography is a powerful laboratory-based analytical method that is being employed by researchers as the scientific community strives to understand the Sars-CoV-2 virus and develop better therapies, vaccines, and diagnostic tools. The SARS-CoV-2 Antigen Rapid Test (ART) is a rapid chromatographic immunoassay for the qualitative detection of specific antigens of SARS-CoV-2 present in the human nasopharynx.

Theoretical Knowledge

In paper chromatography, a drop of solution containing a substance or mixture of substances is spotted along a line near one end of a rectangular piece of filter paper. The paper is the stationary phase and the line is called the origin. The lower edge of the paper is placed in a developing solvent as the mobile phase. Capillary action causes the solvent to flow up the paper at a uniform rate creating a "wet" line across the paper. This line is called the solvent front.

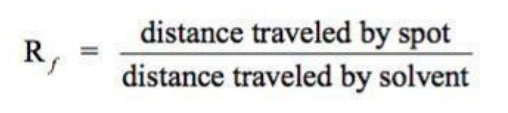
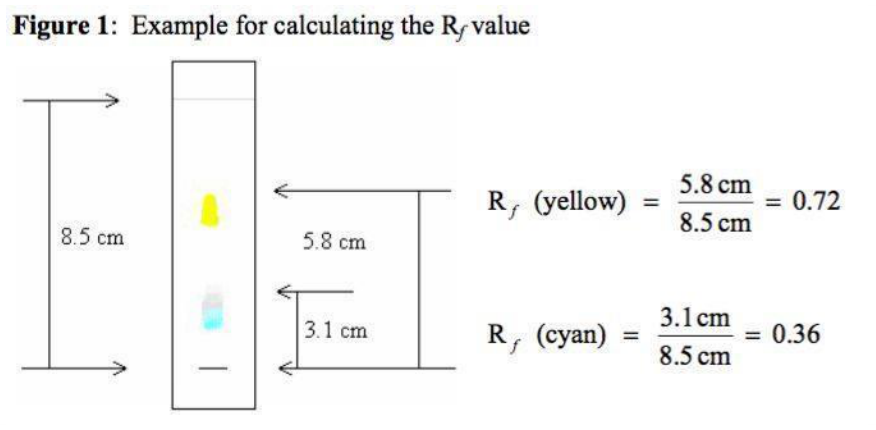
It is possible to describe the position of spots (so the substances that have separated) in terms of their retention factor, the Rf value (Figure 1). The retention factor is defined as:
Question illustration

Accessible transcription: $R_f=\frac{\text{distance travelled by the substance from the origin}}{\text{distance travelled by the solvent front from the origin}}$.

Because the retention factor for a particular mixture varies depending on conditions, a sample of known composition is typically analyzed at the same time on the same sheet of paper or slide. The Rf value is a characteristic property of a given compound in a given solvent on a particular stationary phase.
Question illustration

Figure 1: Example for calculating the Rf value. Solvent front: 8.5 cm from origin; yellow spot: 5.8 cm, Rf = 5.8/8.5 = 0.72 as printed; cyan spot: 3.1 cm, Rf = 3.1/8.5 = 0.36 as printed. Editorial note: the printed yellow result contains an arithmetic inconsistency; see the explanation. These are the source's illustrative values, not results for your candy.

Apparatus List
- 1 small pack of color coated chocolate candies (example M&M’s®)
- Filter paper
- Pen
- Pencil
- Ruler
- pipette (or dropper)
- petri dish or plastic lid (saucer)
- ice cream stick or toothpick
- binder clips (3 pcs)
- 100 mL beaker or glass container
- 500 mL beaker or glass container with a wide mouth (2 pcs)
- 1 Liter container
- Salt (sodium chloride)
- Teaspoon
- Measuring cup or cylinder
- Mass balance (optional)
- 1100 mL of pure water (non-mineralized)
- 200 mL 70% ethyl alcohol (disinfectant alcohol)
- Wooden splint or skewer sticks (3 pcs)
- Adhesive tape or glue to stick the chromatogram onto test paper for submission
- Paper towel or Tissue for cleaning and water spills
- Small trash bag

Procedure

Part 1: Preparing the chromatography strips


1\. Cut the coffee filter paper to make approximately 2 cm wide by 7.5 cm long strips. You will need at least 6 chromatography (coffee filter paper) strips.

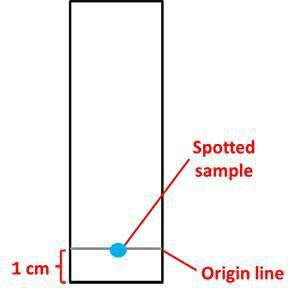
2\. Draw a pencil line 1 cm from the edge of each strip of paper, as shown in Figure 2 below.
- This will be the origin line or baseline.
- You will spot the candy colour for each strip right on this line, as shown in Figure 3.
Question illustration

Figure 3: Each chromatography strip will have an origin line (baseline). The dye to be tested will be spotted in the middle of the origin line.

Editorial note: the source refers to Figure 2 here, but the supplied illustration is captioned Figure 3; the original numbering is preserved.

Part 2: Extract the candy dyes


3\. Choose three colors of candies you want to test.
- For example, you could test red, green and blue M&Ms®.

4\. Fill the 100 mL beaker with some water.

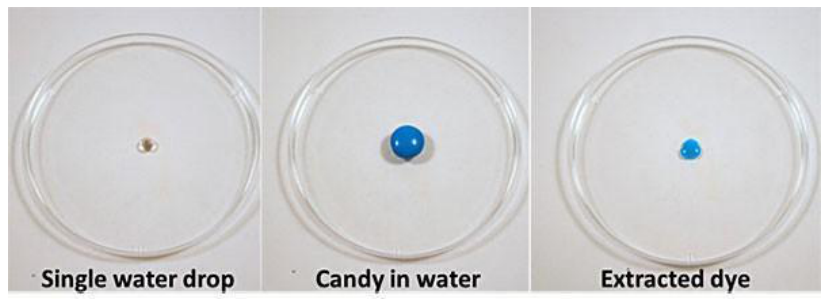
5\. Use the pipette (dropper) to put a single drop of water in the clean plate or plastic lid as shown in Figure 4 below. Set one candy in the drop of water.
Question illustration

Figure 4. To extract the candy dye, leave a piece of candy in a single drop of water for three minutes. When you remove the candy, a puddle of dye will be left behind.


6\. Leave the candy in the drop of water for three minutes to allow the dye to dissolve.

7\. Remove the candy, then dip a pipette tip, clean ice cream stick or toothpick, into the now-coloured drop of water.

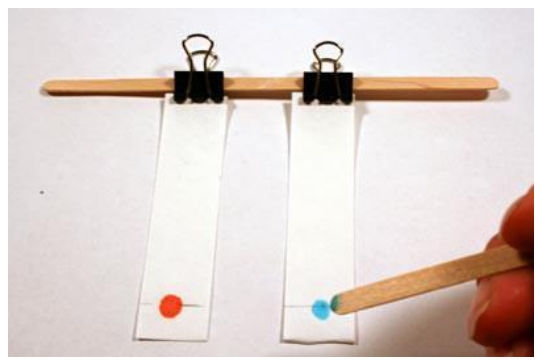
8\. Spot the candy dye solution onto the chromatography strip by touching the pipette tip, or a wooden splint, to the strip, right in the canter of the origin line as shown in Figure 5 below.
Question illustration

Figure 5. Spot the extracted candy dye onto the paper chromatography strips using the tip of a wooden splint or a pipette.

- Allow the spot on the strip to dry completely (this should take approximately 1 minute).
- Repeat step 8, 3–5 more times. You want to make sure to have enough dye on the chromatography strip so that you can see the dye components when they separate out on the paper.


9\. Repeat step 5 for the other two colours of candy you want to test.

Part 3: Set-up


10\. Prepare a 0.1% salt solution for the chromatography solvent.
- Add 1/8 teaspoon of salt to 4 cups of water (approximately 1 g of salt to 1 L of water).
- Shake or stir until the salt is completely dissolved.

11\. Pour a small amount of the salt solution into the 500 mL beaker.

12\. Clip two of the prepared chromatography strips to a wooden splint.
- Make sure the two strips do not touch each other or the beaker and that their bottoms are aligned.
- Rest the splint on top of the beaker so that the strips hang straight into the beaker.
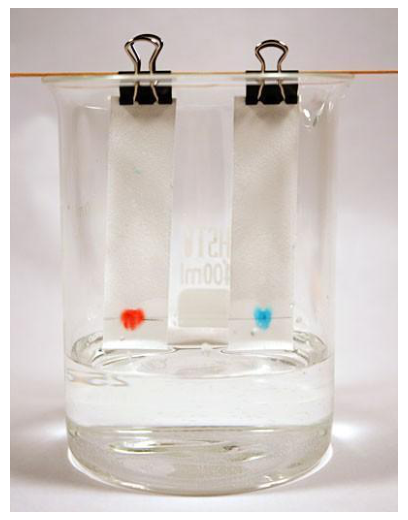
- If necessary, add more of the salt solution. The goal is to have the end of the chromatography strips just touching the surface of the solvent solution (salt solution), as shown in Figure 6 below.
Question illustration

Figure 6. Your chromatography setup should look similar to this example. The edge of the chromatography strips should just barely touch the solvent.


13\. Let the solvent rise up the strip (by capillary action) until it is about 0.5 cm from the top then remove the strip from the solvent. Depending on the chromatography paper, this can take anywhere from 15–30 minutes. Regularly check on your chromatography strip and the solvent front—if you let it run too long the dye may run off the paper and become distorted.
- Be patient and do not take the paper strip out of the solvent early. The longer you keep the paper strip in the solvent, the better your separation will be!

14\. Use a pencil to mark how far the solvent rose.

15\. Allow the chromatography strip to dry, then measure (in centimeters) and calculate the Rf value for each candy color (or food coloring) dye component. Record your results in a table.

16\. Repeat steps 12–15 until you have run all of the chromatography strips.
- Each time you run the experiment make sure there is enough solvent in the beaker. Add more solvent (salt solution) as needed.

17\. Repeat steps 10–16 using a 70% ethyl alcohol as the solvent and one color only.

Part 4: Results


18\. Create a data table like Table 1 for each candy type and colour or food colouring that you have tested.


Colour of the candy: ____________________

Solvent used: ____________________

| Component Colour | Component Rf value |
| --- | --- |
| ________________ | ________________ |
| ________________ | ________________ |
| ________________ | ________________ |
| ________________ | ________________ |

Total number of components: ____________________ [2 marks]


Colour of the candy: ____________________

Solvent used: ____________________

| Component Colour | Component Rf value |
| --- | --- |
| ________________ | ________________ |
| ________________ | ________________ |
| ________________ | ________________ |

Total number of components: ____________________ [2 marks]


Colour of the candy: ____________________

Solvent used: ____________________

| Component Colour | Component Rf value |
| --- | --- |
| ________________ | ________________ |
| ________________ | ________________ |
| ________________ | ________________ |

Total number of components: ____________________ [2 marks]


Colour of the candy: ____________________

Solvent used: 70% Ethyl Alcohol

| Component Colour | Component Rf value |
| --- | --- |
| ________________ | ________________ |
| ________________ | ________________ |
| ________________ | ________________ |
| ________________ | ________________ |

Total number of components: ____________________ [2 marks]


Stick the Chromatogram here and label them properly:

[Blank submission area: attach and label all actual chromatograms.]

Part 5: Cleaning


19\. Clean and fix your table with a paper towel and alcohol.

Questions


1\. Why do you think some dyes separate into different colours while others do not? [1]

2\. Why do you think some colours move further up the paper than others? [1]

3\. Why is it necessary that the solvent level be below the origin line? [1]

4\. Why is it not recommended to use a pen to draw the origin line? [1]

5\. Can you think of any way of improving the separation between the different spots? [1]

6\. Look on the side of the packet of the chocolate candy for a list of the coloured dyes used. Try to identify which dyes correspond to the spots on the chromatogram. [1]

END OF EXPERIMENTS

Editorial safety note: Work with adult supervision. Avoid burns from hot water in Experiment 1. Ethanol is flammable: keep it away from flames, sparks and heat; use ventilation and avoid eye contact. Do not eat experimental candies or drink any solutions. Follow local laboratory safety and disposal instructions. For step 17, replace the salt solution with 70% ethanol; do not add the step-10 salt recipe to ethanol.
Question 1

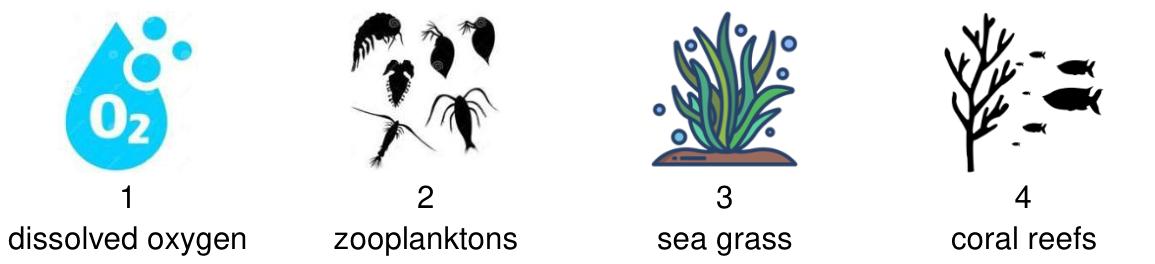
Oxygen plays an important part in the metabolic process of living things. Like on land, fish and other marine organisms require oxygen to conduct cellular respiration. The illustrations show 1 dissolved oxygen, 2 zooplanktons, 3 sea grass, and 4 coral reefs. Which are possible sources of oxygen underwater?

Question illustration
  1. 1, 2, and 3
  2. 2, 3, and 4
  3. 1, 3, and 4
  4. 1, 2, and 4

Question 2

Mr. Tan collected five identical rubber fruits A–E and subjected them to different temperatures to test whether temperature affects splitting.

| Rubber fruit | A | B | C | D | E |
| --- | --- | --- | --- | --- | --- |
| Temperature / Nhiệt độ | 25°C | 30°C | 35°C | 40°C | 45°C |
| Time to split / Thời gian nứt | Does not split / Không nứt | 1 day / 1 ngày | 3 h | 2 h | 30 min |
| Seed distance / Tầm xa | — | 1 m | 1.5 m | 2.5 m | 4 m |

Which fruit splits with the greatest force?
  1. B
  2. C
  3. D
  4. E

Question 3

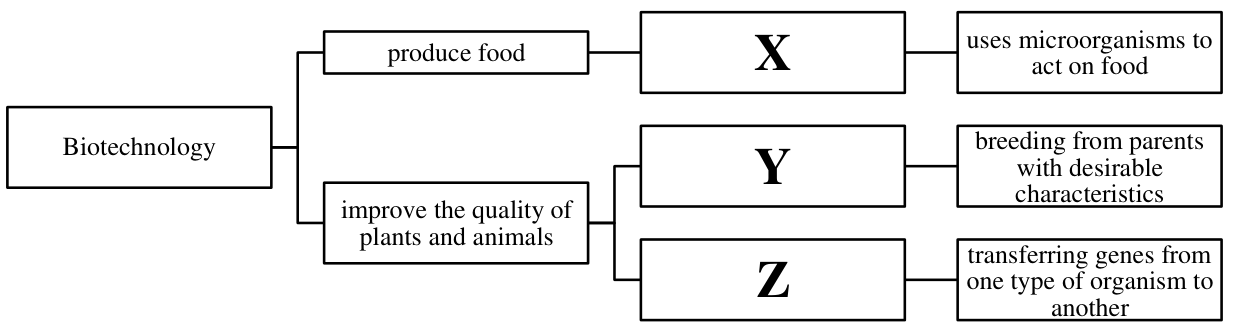
Biotechnology is biology-based technology that uses an organism or its parts to create a new or improved product. The flowchart shows: produce food → X → uses microorganisms to act on food; improve plants and animals → Y → breeding parents with desirable characteristics; improve plants and animals → Z → transferring genes from one organism type to another. Which headings match X, Y, Z?

Question illustration
  1. Genetic selection; Fermentation; Genetic engineering
  2. Fermentation; Genetic selection; Genetic engineering
  3. Genetic engineering; Fermentation; Genetic selection
  4. Genetic engineering; Genetic selection; Fermentation

Question 4

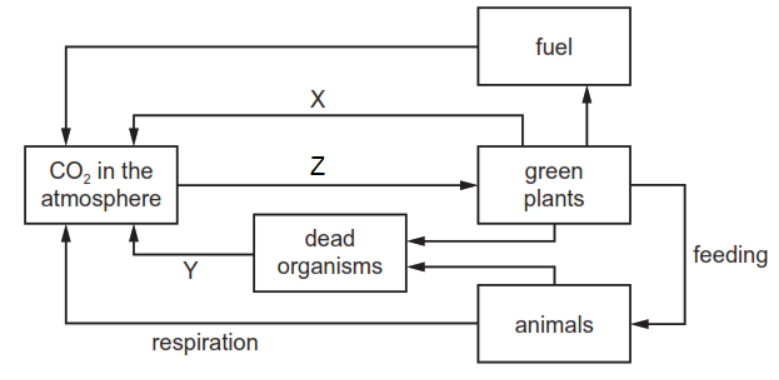
The diagram shows part of the carbon cycle. Which statements are correct?

I. Process X needs glucose to produce water and energy for the plant.
II. Dead organisms are broken down into simpler matter such as CO₂ and H₂O.
III. Green plants obtain glucose for energy from process Z.
IV. Organisms such as slugs, maggots, and bacteria can carry out process Y.

Question illustration
  1. I, II, III only
  2. I, III, IV only
  3. II, III, IV only
  4. All of the above

Question 5

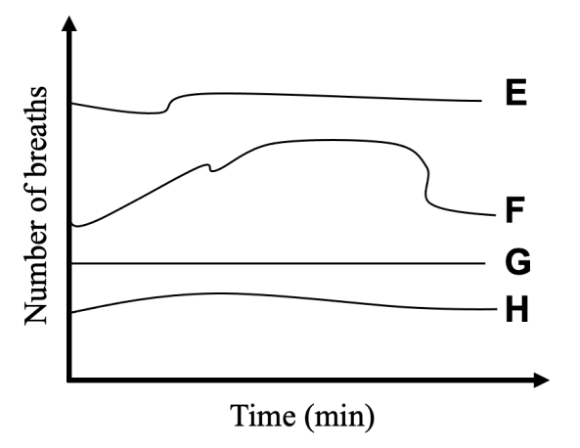
A community health study records breathing rates for a grandfather, father, mother, and child. The mother has asthma and was wheezing and coughing during data collection. Use these supplied concepts: children breathe faster than adults; asthma attacks can cause suddenly increased breathing rates; an old person has a lower breathing rate than a normal healthy adult. Which graph E, F, G, or H represents the mother?

Question illustration
  1. E
  2. F
  3. G
  4. H