Skip to content / Đến nội dung
ThichHocToan.com

Question bank IMSO Science 2018

Exam papers

46 questions

Question 1

PART I: FLOATING AND SINKING

Archimedes of Syracuse (c. 287–212 BC), an ancient Greek mathematician, physicist, engineer, inventor and astronomer, discovered around 250 BC the relationship between buoyancy and the weight of displaced fluid. Archimedes’ Principle states that the upward buoyant force on an object immersed in a fluid equals the weight of fluid displaced:

$F_{\mathrm{buoyant}}=W_{\mathrm{fluid}}=m_{\mathrm{fluid}}g=\rho_{\mathrm{fluid}}Vg$, where $g\approx10\,\mathrm{m/s^2}$, $\rho$ is fluid density and $V$ is displaced fluid volume.

Aim: Determine the density of unknown liquid X using Archimedes’ Principle.

Apparatus: Iron stand with clamp; spring balance; 250 ml graduated cylinder; 250 ml beaker; scissors; string; modelling clay (also called plasticine); beaker containing liquid X; cloth/paper towels for drying.

Safety: Handle glassware carefully; broken glassware results in deductions in the original test. Do not drink or taste liquid X. Do not eat or taste the clay.

Procedure (the source skips step number 6):

1\. Use the spring balance to measure 50 g of modelling clay.

2\. Use the graduated cylinder to measure the clay volume $V$. Record all measurements in the answer table.

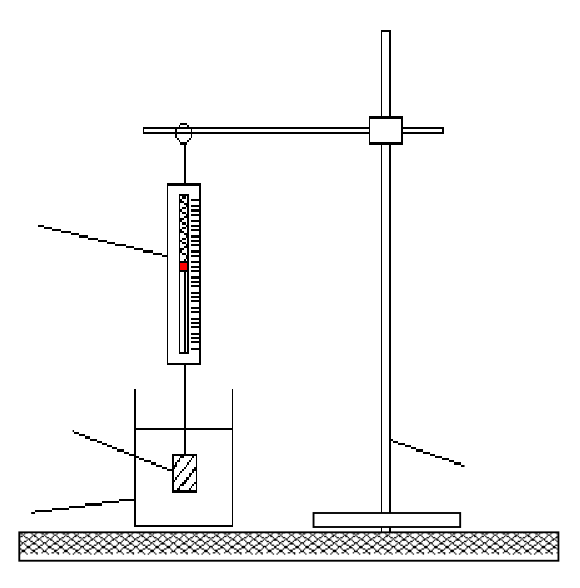
3\. Attach the 50 g clay again to the spring balance. Fill a beaker with 250 ml of liquid X and lower the balance so that the clay is completely submerged, without touching the beaker. Refer to the setup figure.

4\. Record the new mass reading of the clay on the spring balance.

5\. Find the mass $m_X$ of displaced liquid X from the difference between the balance readings before and after immersion.

7\. Repeat steps 1–5 for 70 g and 100 g of clay.

8\. Plot mass of displaced liquid against volume of clay on Graph 1.

Practical editorial safety note: The source lists a 250 ml beaker and also says to fill it with 250 ml before immersion. Use a sufficiently large vessel with headroom, or ask the supervisor for a safe adjustment; prevent overflow and keep the clay fully immersed. Record any adjustment.

Results: Complete three rows using your own measurements. No observations are supplied.

| Volume $V$ (ml) | Clay mass in air (g) | Clay mass reading in X (g) | Displaced liquid mass $m_X$ (g) |
| --- | --- | --- | --- |
| ____ | ____ | ____ | ____ |
| ____ | ____ | ____ | ____ |
| ____ | ____ | ____ | ____ |

(a) What is the correlation between the mass of liquid X displaced and the volume of modelling clay? [2 source points]

(b) From this relationship, how do you determine the density of X from your graph? Calculate it. [3 source points]

(c) Which measured values should you plot to determine the density of the clay? Plot them on Graph 2 and calculate the clay density from the graph.

(d) Will this experiment work for masses that float partially in the liquid? Briefly explain and state the modifications needed.

Response spaces (a)–(d): __________________________________________________

Graph 1: Floating and sinking. Add axes, units, scale and your measured points to the blank grid. Do not invent readings.

Question illustration

Graph 2: Floating and sinking. Choose the variables requested in (c), label axes and plot your measured points.
Question illustration


Question illustration

Question 2

PART II: MAXIMUM VOLUME OF THE CARGO

Archimedes’ Principle has important applications to floating boats and ships and their maximum cargo. In general, the source gives:

Mass of boat and cargo ≤ mass of water displaced by the boat.

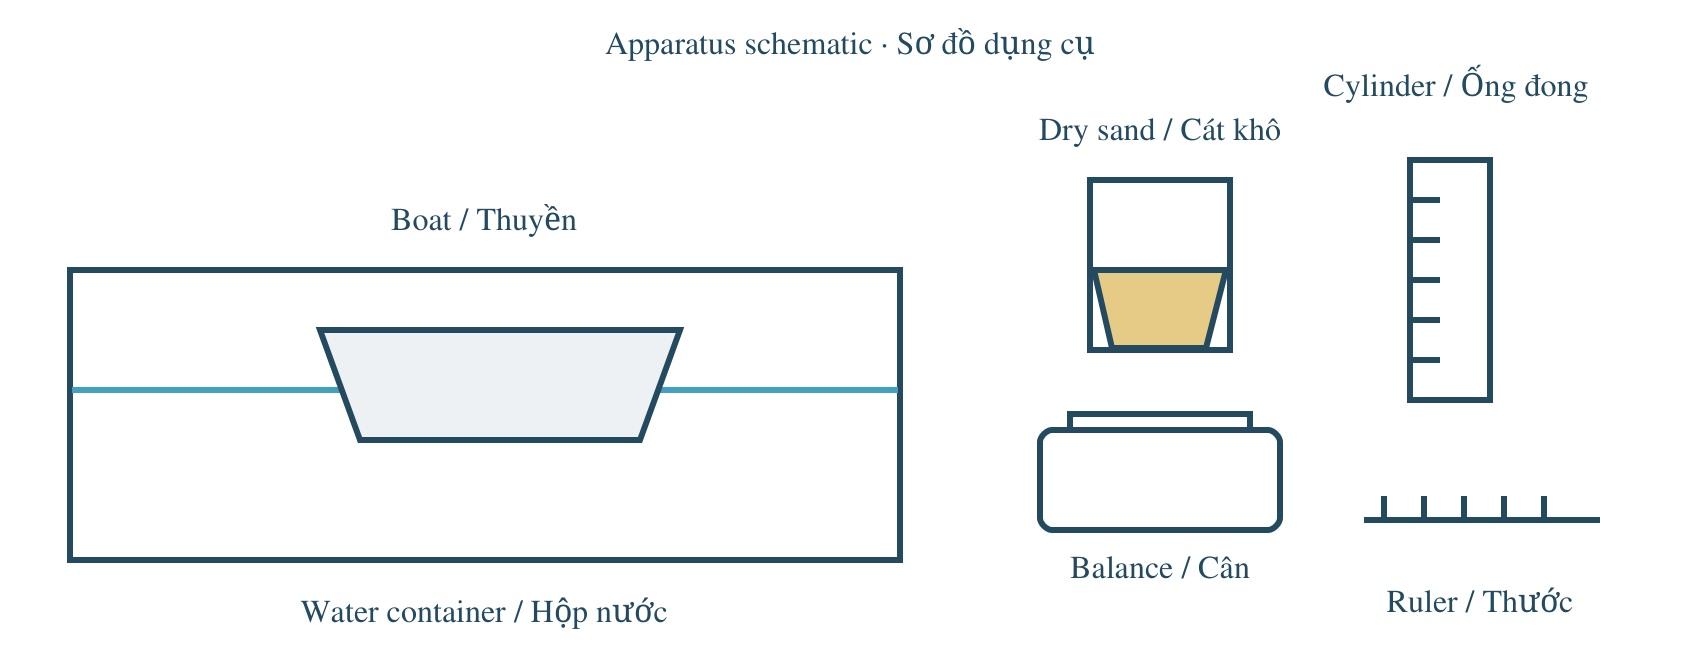
Design and conduct an experiment to determine the maximum volume of a precious sand that your small plastic boat can carry on fresh water (density 1.0 g/ml) before it sinks, in order to decide the storage space required. The sand must stay dry. Only a small sample of sand is supplied; it must not touch water because it takes an extremely long time to dry.

Available apparatus:
- Plastic cup containing a small sample of sand
- Boat (a plastic container that floats on water)
- Standard masses and paper clips
- Electronic mass balance
- 100 ml measuring cylinder and 250 ml measuring cylinder
- 250 ml beaker
- 30 cm ruler
- Water
- Plastic container for testing
- Cloth for drying

Aim: Design the procedure, conduct the experiment and determine the maximum volume of sand that the boat can carry. In your plan state clearly the measurements, apparatus and all necessary calculations. You need not use every item provided.

Design: __________________________________________________

_________________________________________________________

Results: __________________________________________________

_________________________________________________________

(a) Sea water has a slightly greater density than fresh water (about 1.03 g/ml, equivalently 1.03 g/cm³). Would you expect the volume of sand that can be carried to be smaller than, equal to or larger than the volume determined in your fresh-water experiment? Explain.

(b) Your boat will transport sand across the sea (salt water), but the harbors at both ports contain fresh water. Should you still test with fresh water, use salt water, or use both and determine the average? Explain briefly.

Answer (a): ______________________________________________

Answer (b): ______________________________________________

Optional blank recording aid (editorial; the original provides unstructured Design and Results spaces). Choose and label measurements suitable for your own method; leave missing observations blank.

| Measured quantity and apparatus | Value | Unit |
| --- | --- | --- |
| ____ | ____ | ____ |
| ____ | ____ | ____ |
| ____ | ____ | ____ |
| ____ | ____ | ____ |
| ____ | ____ | ____ |
| ____ | ____ | ____ |

Question illustration

Question 1

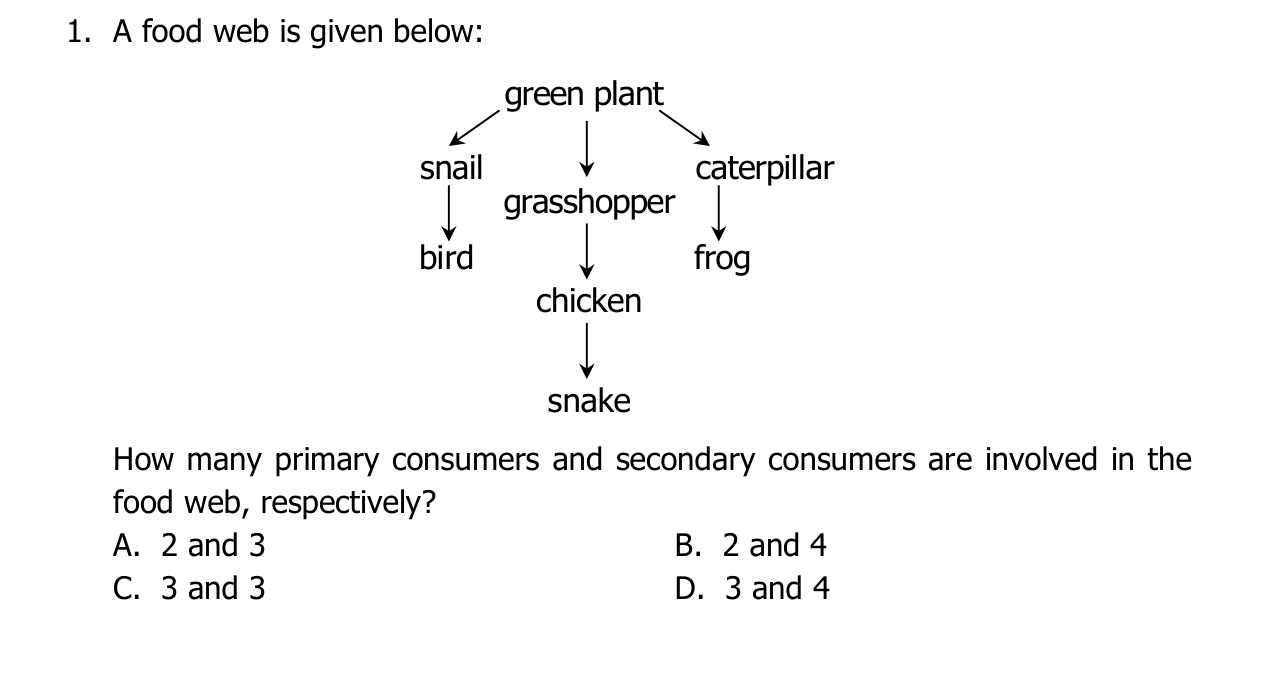
A food web is given below:
How many primary consumers and secondary consumers are involved in the
food web, respectively?
A. 2 and 3
B. 2 and 4
C. 3 and 3
D. 3 and 4
green plant
caterpillar
snail
grasshopper
chicken
frog
bird
snake

Question illustration
  1. 2 and 3
  2. 2 and 4
  3. 3 and 3
  4. 3 and 4

Question 2

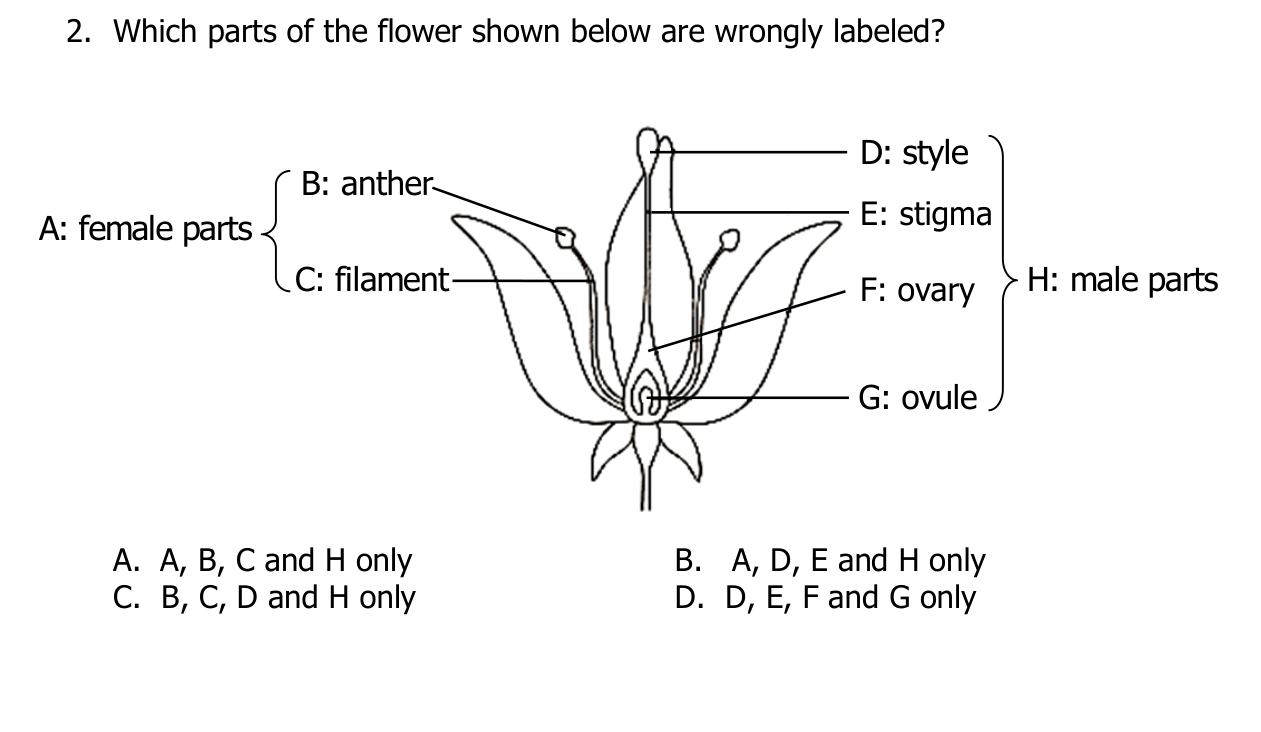
Which parts of the flower shown below are wrongly labeled?
A. A, B, C and H only
B. A, D, E and H only
C. B, C, D and H only
D. D, E, F and G only
D: style
E: stigma
F: ovary
G: ovule
H: male parts
B: anther
C: filament
A: female parts

Question illustration
  1. A, B, C and H only
  2. A, D, E and H only
  3. B, C, D and H only
  4. D, E, F and G only

Question 3

Which of the following electrical appliances will produce heat when they are
turned on?
(1) air-conditioner
(2) electric bulb
(3) fan
(4) refrigerator
A. (1) and (2) only
B. (1) and (3) only
C. (2) and (3) only
D. (1) (2) (3) and (4)

Question illustration
  1. (1) and (2) only
  2. (1) and (3) only
  3. (2) and (3) only
  4. (1) (2) (3) and (4)

Question 4

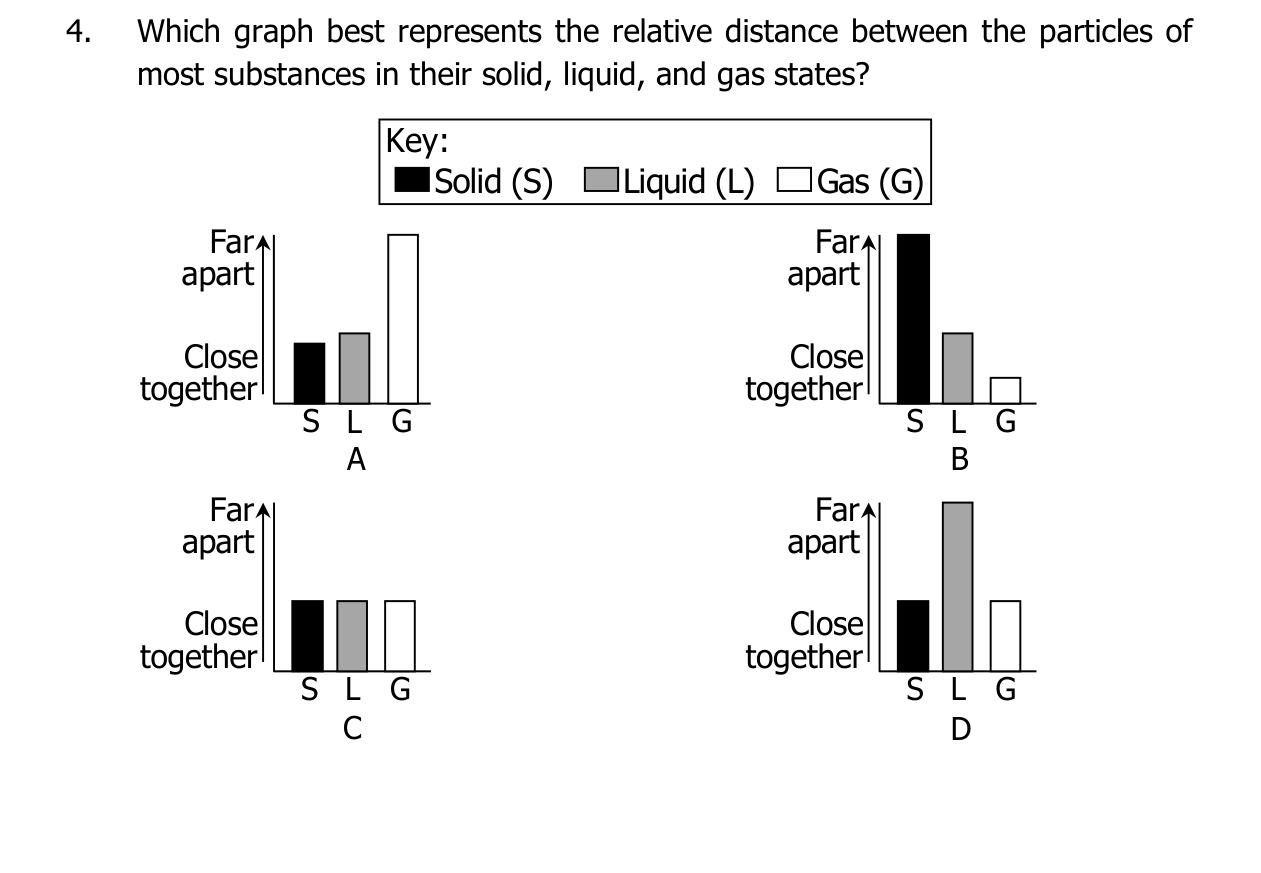
Which graph best represents the relative distance between the particles of
most substances in their solid, liquid, and gas states?
A
S
L
G
Far
apart
Close
together
C
S
L
G
Far
apart
Close
together
D
S
L
G
Far
apart
Close
together
B
S
L
G
Far
apart
Close
together
Key:
Solid (S)
Liquid (L)
Gas (G)

Question illustration
  1. Graph A
  2. Graph B
  3. Graph C
  4. Graph D

Question 5

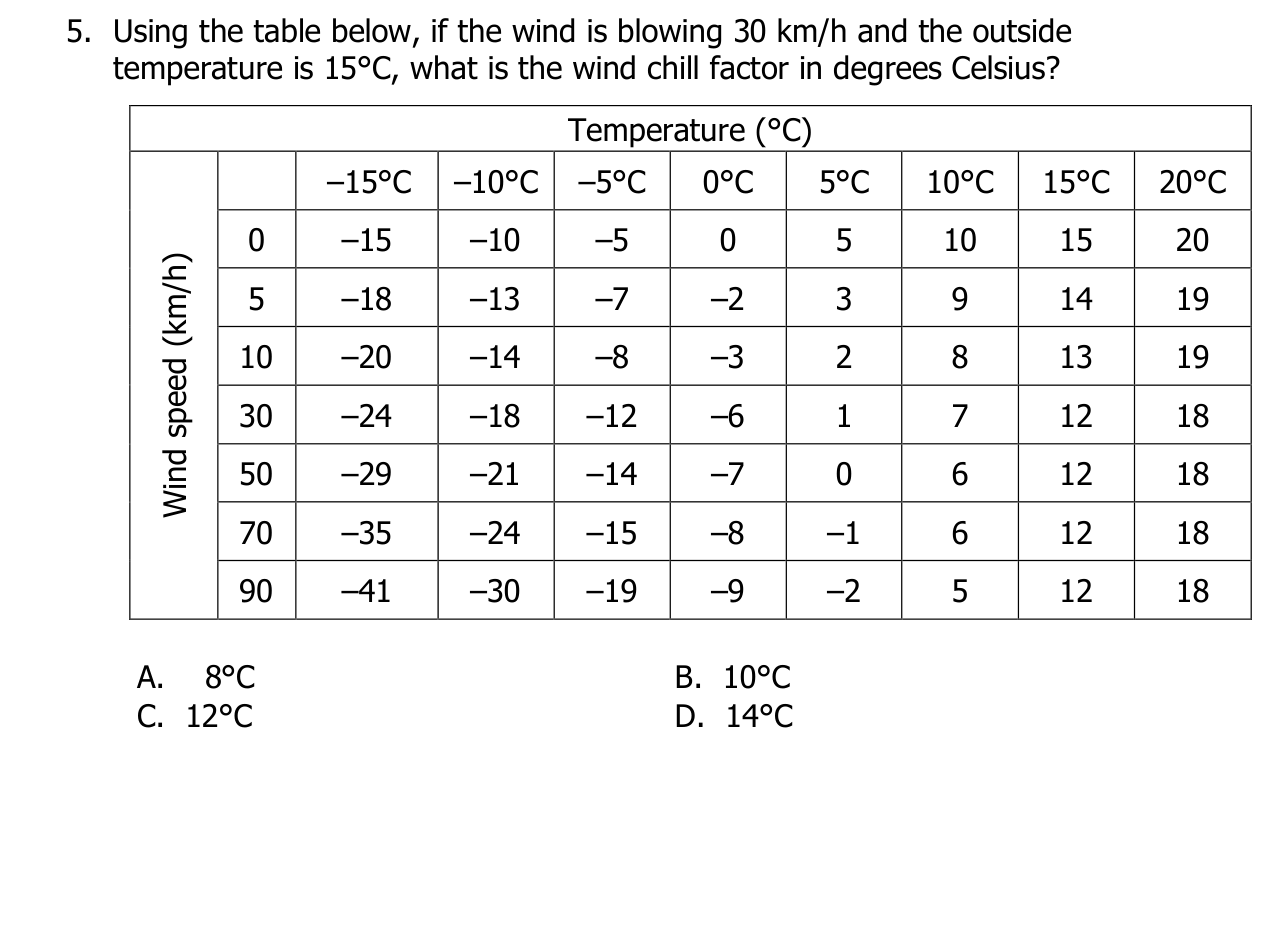
Using the table below, if the wind is blowing 30 km/h and the outside
temperature is 15°C, what is the wind chill factor in degrees Celsius?
Temperature (°C)
Wind speed (km/h)
–15°C
–10°C
–5°C
0°C
5°C
10°C
15°C
20°C
0
–15
–10
–5
0
5
10
15
20
5
–18
–13
–7
–2
3
9
14
19
10
–20
–14
–8
–3
2
8
13
19
30
–24
–18
–12
–6
1
7
12
18
50
–29
–21
–14
–7
0
6
12
18
70
–35
–24
–15
–8
–1
6
12
18
90
–41
–30
–19
–9
–2
5
12
18
A. 8°C
B. 10°C
C. 12°C
D. 14°C

Question illustration
  1. 8°C
  2. 10°C
  3. 12°C
  4. 14°C

Question 6

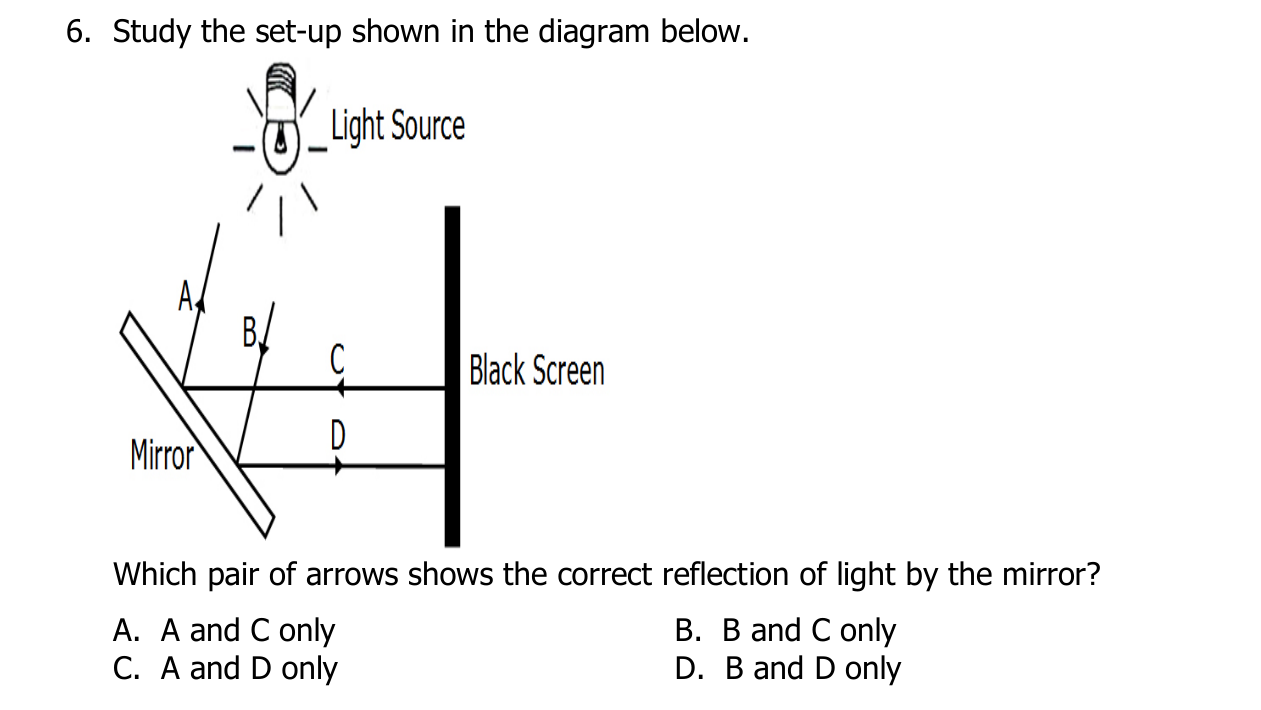
Study the set-up shown in the diagram below.
Which pair of arrows shows the correct reflection of light by the mirror?
A. A and C only
B. B and C only
C. A and D only
D. B and D only

Question illustration
  1. A and C only
  2. B and C only
  3. A and D only
  4. B and D only

Question 7

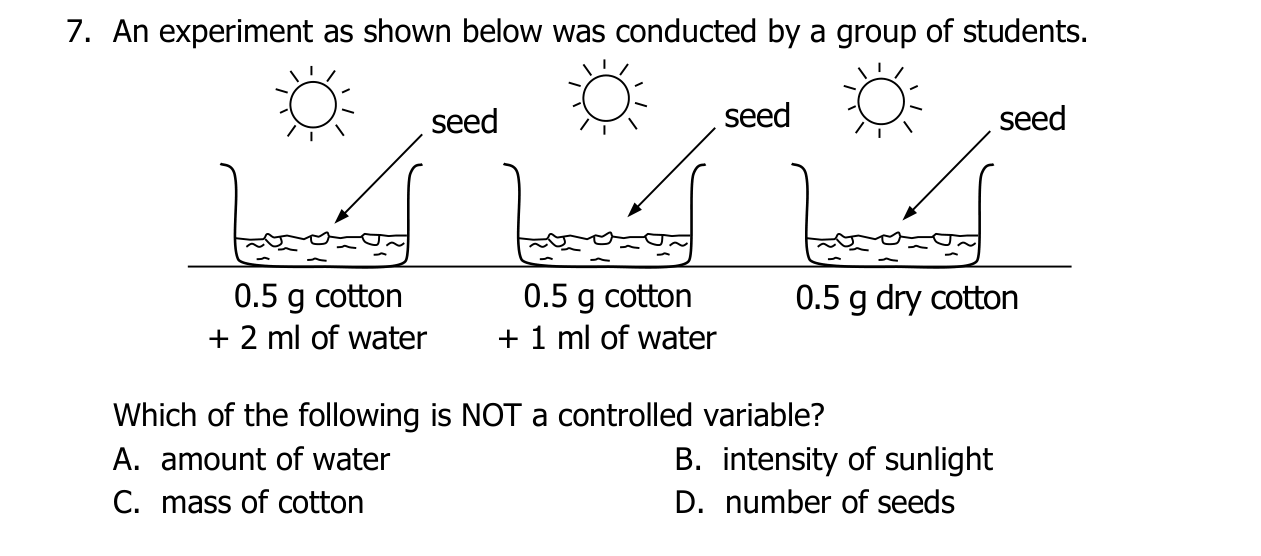
An experiment as shown below was conducted by a group of students.
Which of the following is NOT a controlled variable?
A. amount of water
B. intensity of sunlight
C. mass of cotton
D. number of seeds
0.5 g cotton
+ 2 ml of water
0.5 g dry cotton
0.5 g cotton
+ 1 ml of water
seed
seed
seed

Question illustration
  1. amount of water
  2. intensity of sunlight
  3. mass of cotton
  4. number of seeds

Question 8

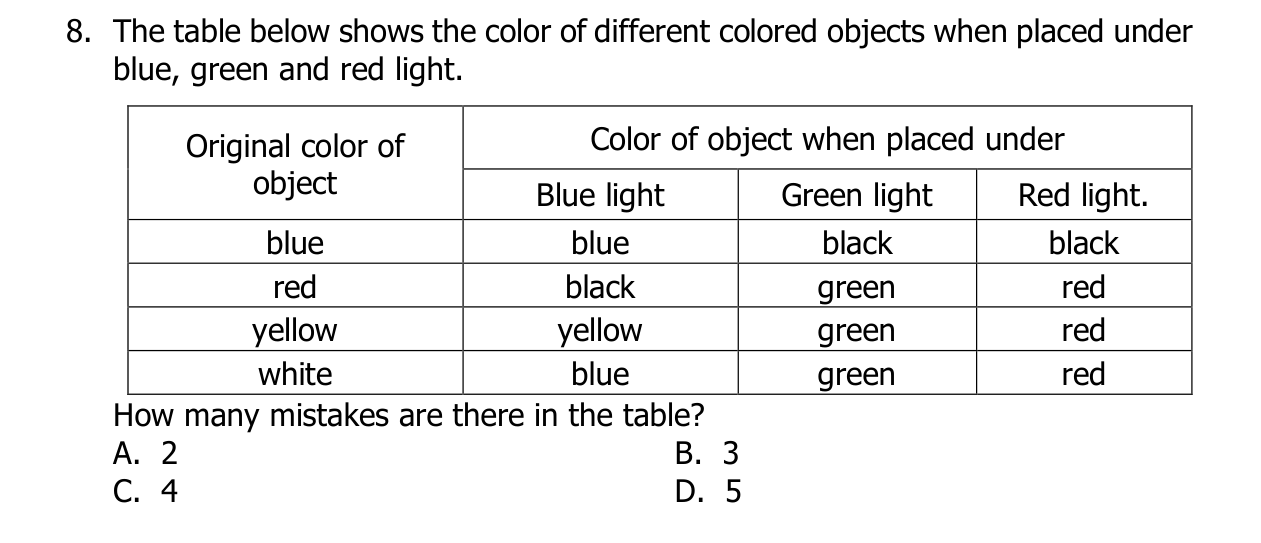
The table below shows the color of different colored objects when placed under
blue, green and red light.
Original color of
object
Color of object when placed under
Blue light
Green light
Red light.
blue
blue
black
black
red
black
green
red
yellow
yellow
green
red
white
blue
green
red
How many mistakes are there in the table?
A. 2
B. 3
C. 4
D. 5

Question illustration
  1. 2
  2. 3
  3. 4
  4. 5

Question 9

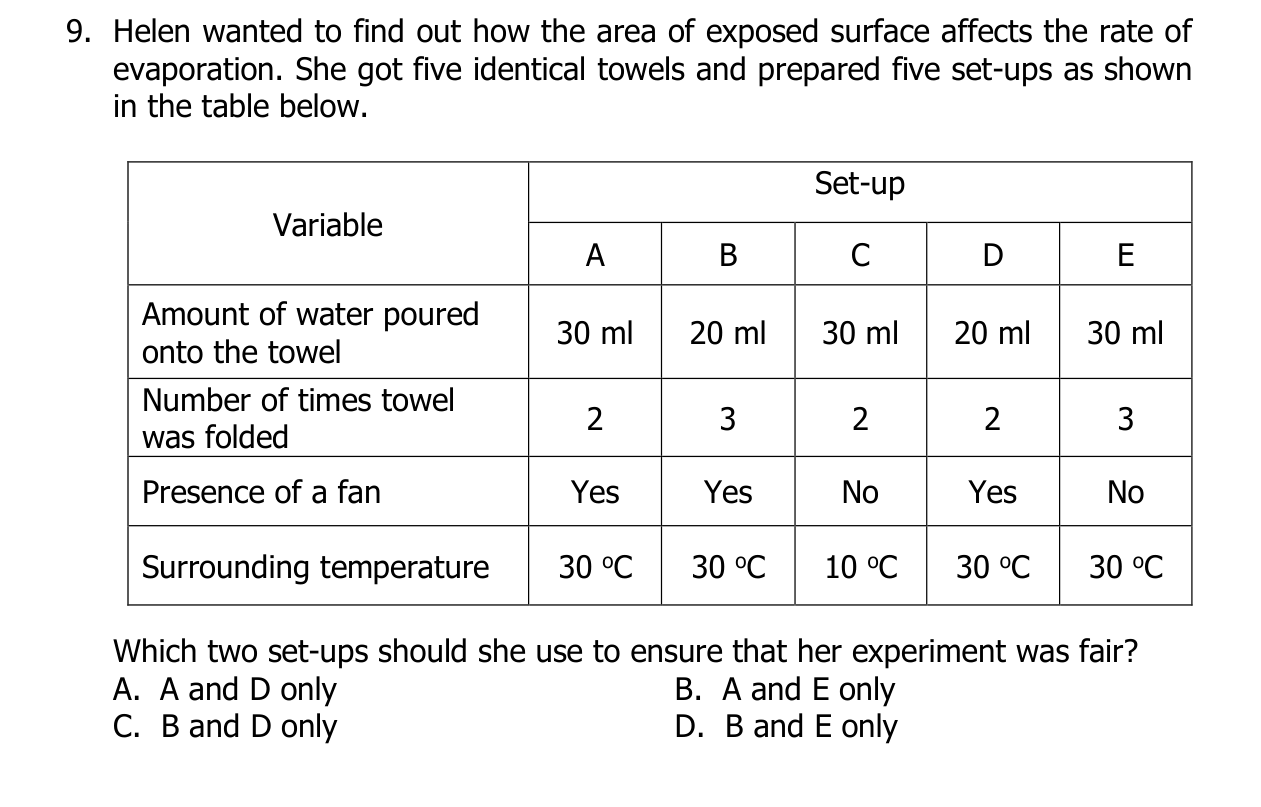
Helen wanted to find out how the area of exposed surface affects the rate of
evaporation. She got five identical towels and prepared five set-ups as shown
in the table below.
Variable
Set-up
A
B
C
D
E
Amount of water poured
onto the towel
30 ml
20 ml
30 ml
20 ml
30 ml
Number of times towel
was folded
2
3
2
2
3
Presence of a fan
Yes
Yes
No
Yes
No
Surrounding temperature
30 oC
30 oC
10 oC
30 oC
30 oC
Which two set-ups should she use to ensure that her experiment was fair?
A. A and D only
B. A and E only
C. B and D only
D. B and E only

Question illustration
  1. A and D only
  2. A and E only
  3. B and D only
  4. B and E only

Question 10

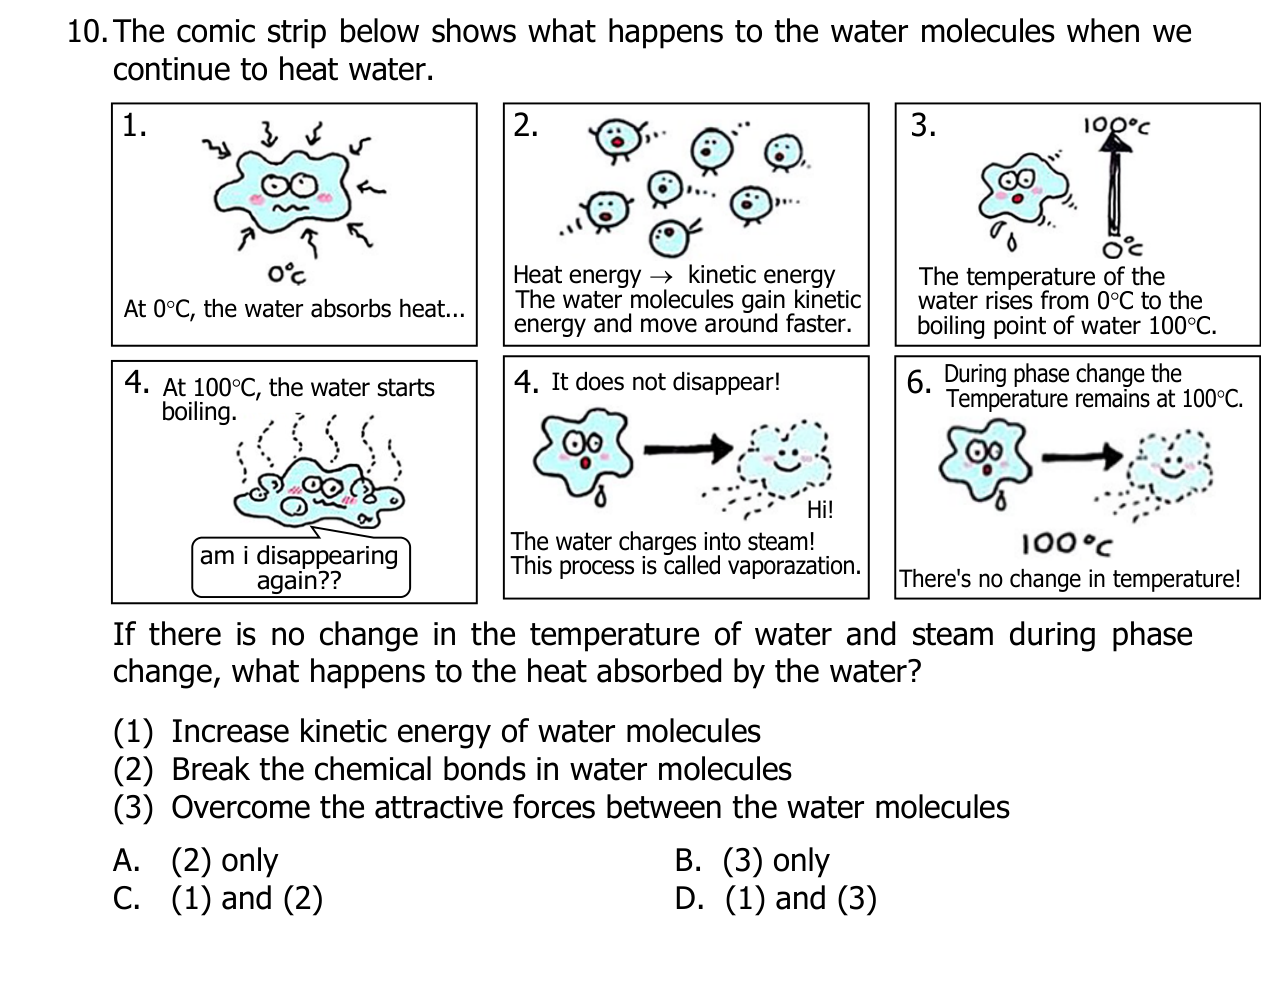
The comic strip below shows what happens to the water molecules when we
continue to heat water.
If there is no change in the temperature of water and steam during phase
change, what happens to the heat absorbed by the water?
(1) Increase kinetic energy of water molecules
(2) Break the chemical bonds in water molecules
(3) Overcome the attractive forces between the water molecules
A. (2) only
B. (3) only
C. (1) and (2)
D. (1) and (3)
1.
At 0 C, the water absorbs heat...
°
2.
Heat energy
kinetic energy
The water molecules gain kinetic
energy and move around faster.
®
3.
The temperature of the
water rises from 0 C to the
boiling point of water 100 C.
°
°
4. At 100 C, the water starts
boiling.
°
am i disappearing
again??
4. It does not disappear!
The water charges into steam!
This process is called vaporazation.
Hi!
6. During phase change the
Temperature remains at 100 C.
°
There's no change in temperature!

Question illustration
  1. (2) only
  2. (3) only
  3. (1) and (2)
  4. (1) and (3)

Question 11

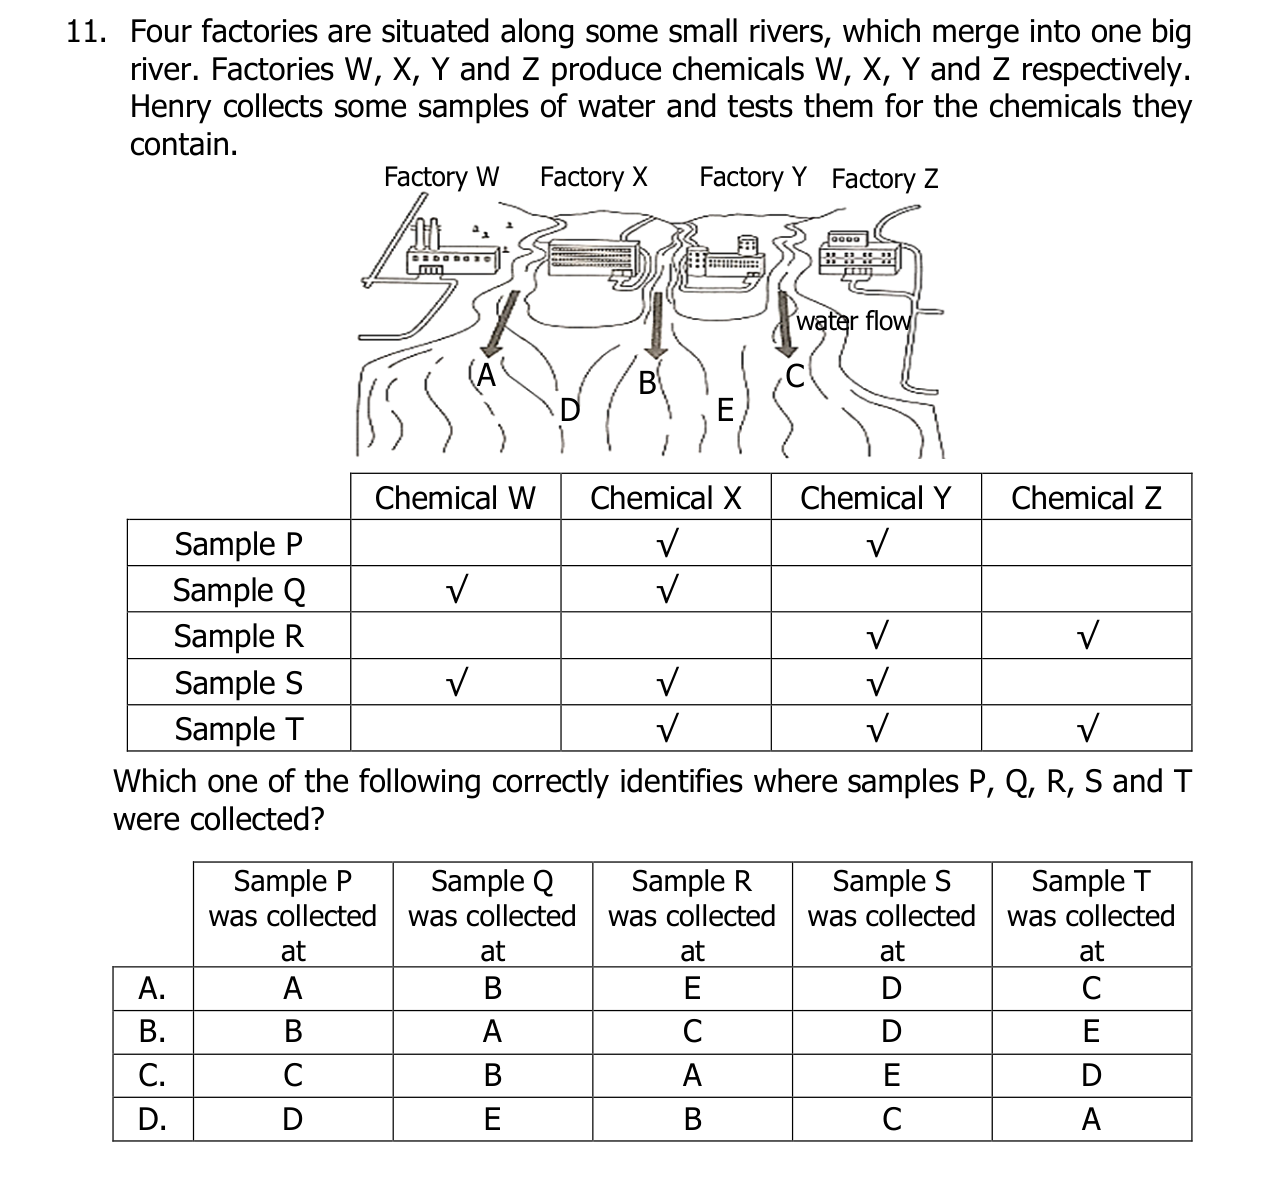
Four factories are situated along some small rivers, which merge into one big
river. Factories W, X, Y and Z produce chemicals W, X, Y and Z respectively.
Henry collects some samples of water and tests them for the chemicals they
contain.
Chemical W
Chemical X
Chemical Y
Chemical Z
Sample P
√
√
Sample Q
√
√
Sample R
√
√
Sample S
√
√
√
Sample T
√
√
√
Which one of the following correctly identifies where samples P, Q, R, S and T
were collected?
Sample P
was collected
at
Sample Q
was collected
at
Sample R
was collected
at
Sample S
was collected
at
Sample T
was collected
at
A.
A
B
E
D
C
B.
B
A
C
D
E
C.
C
B
A
E
D
D.
D
E
B
C
A
Factory W
Factory X
Factory Y
Factory Z
A
D
B
C
E
water flow

Question illustration
  1. A, B, E, D, C
  2. B, A, C, D, E
  3. C, B, A, E, D
  4. D, E, B, C, A

Question 12

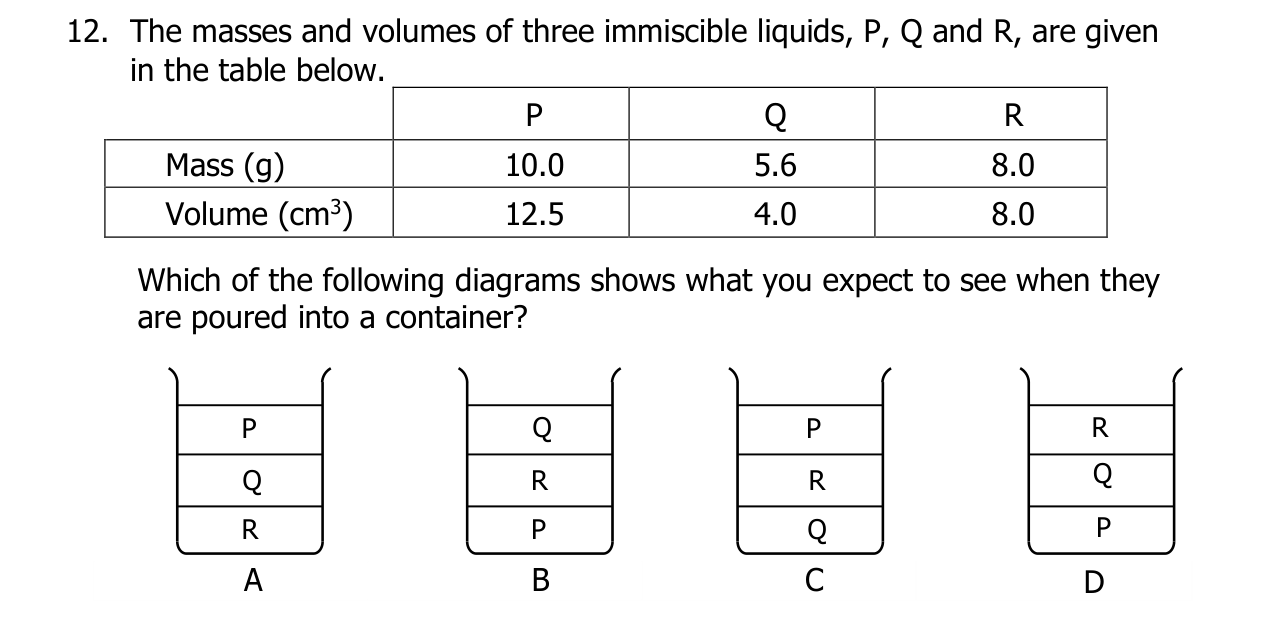
The masses and volumes of three immiscible liquids, P, Q and R, are given
in the table below.
P
Q
R
Mass (g)
10.0
5.6
8.0
Volume (cm3)
12.5
4.0
8.0
Which of the following diagrams shows what you expect to see when they
are poured into a container?
D
P
Q
R
Q
R
P
P
R
Q
R
Q
P
A
B
C

Question illustration
  1. P, Q, R
  2. Q, R, P
  3. P, R, Q
  4. R, Q, P

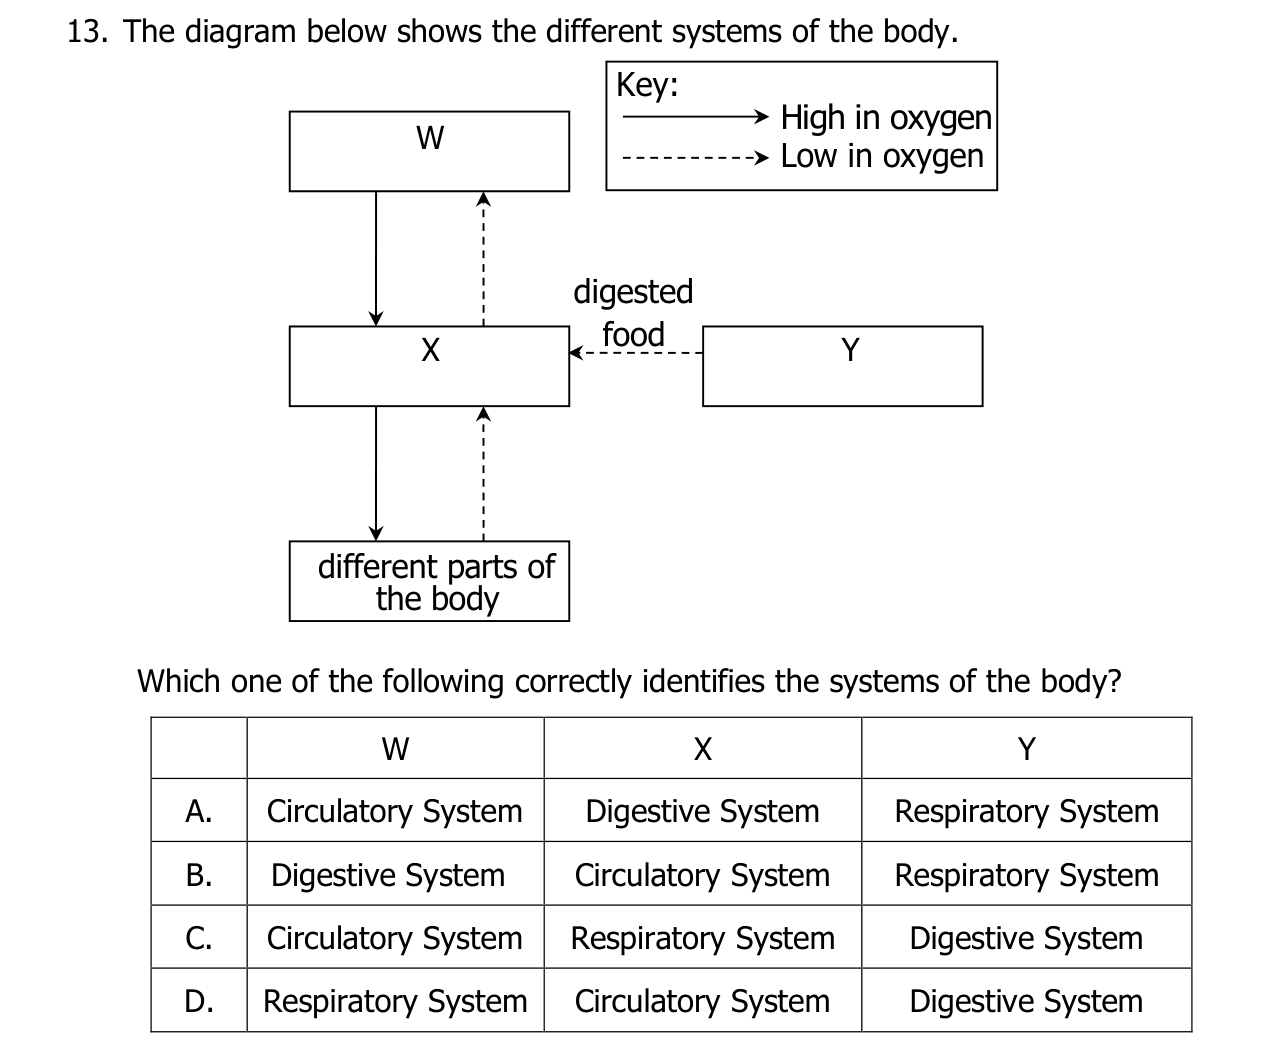
Question 13

The diagram below shows the different systems of the body.
Which one of the following correctly identifies the systems of the body?
W
X
Y
A.
Circulatory System
Digestive System
Respiratory System
B.
Digestive System
Circulatory System
Respiratory System
C.
Circulatory System
Respiratory System
Digestive System
D.
Respiratory System
Circulatory System
Digestive System
Key:
High in oxygen
Low in oxygen
W
X
Y
digested
food
will digested
food
different parts of
the body

Question illustration
  1. Circulatory; Digestive; Respiratory
  2. Digestive; Circulatory; Respiratory
  3. Circulatory; Respiratory; Digestive
  4. Respiratory; Circulatory; Digestive

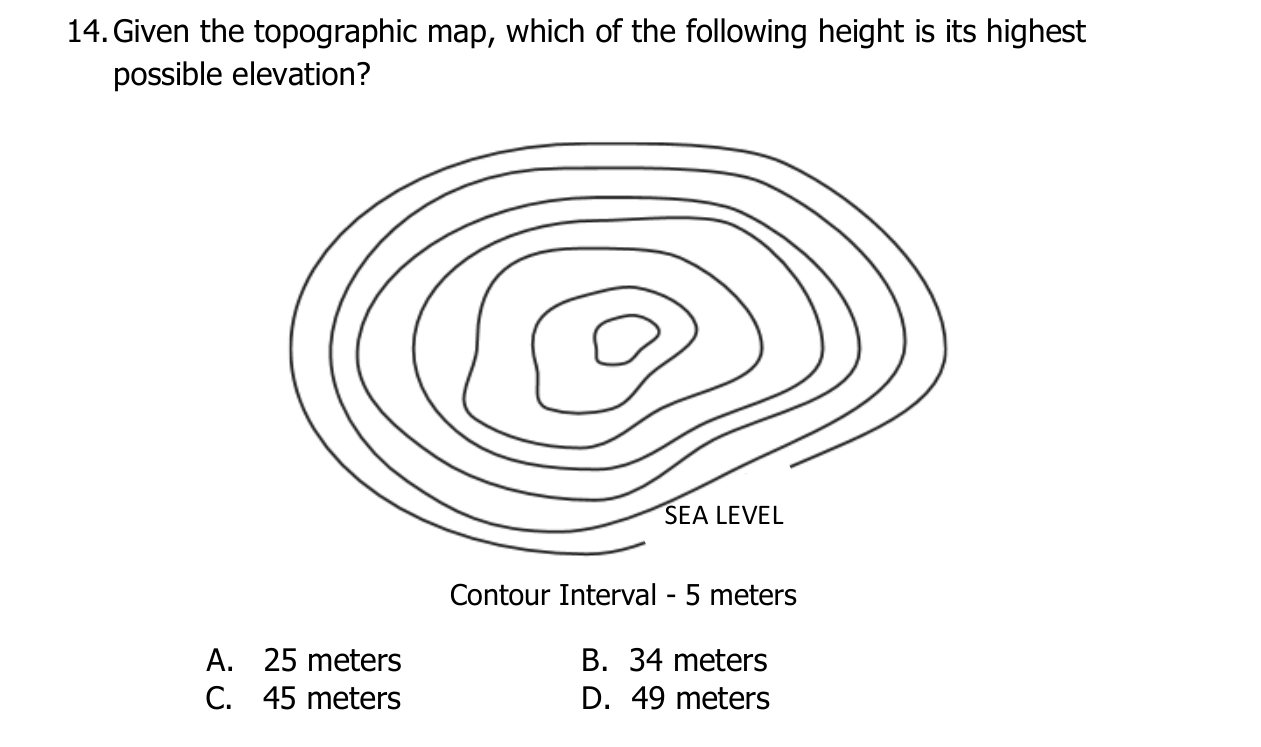
Question 14

Given the topographic map, which of the following height is its highest
possible elevation?
A. 25 meters
B. 34 meters
C. 45 meters
D. 49 meters
Contour Interval - 5 meters
SEA LEVEL

Question illustration
  1. 25 meters
  2. 34 meters
  3. 45 meters
  4. 49 meters

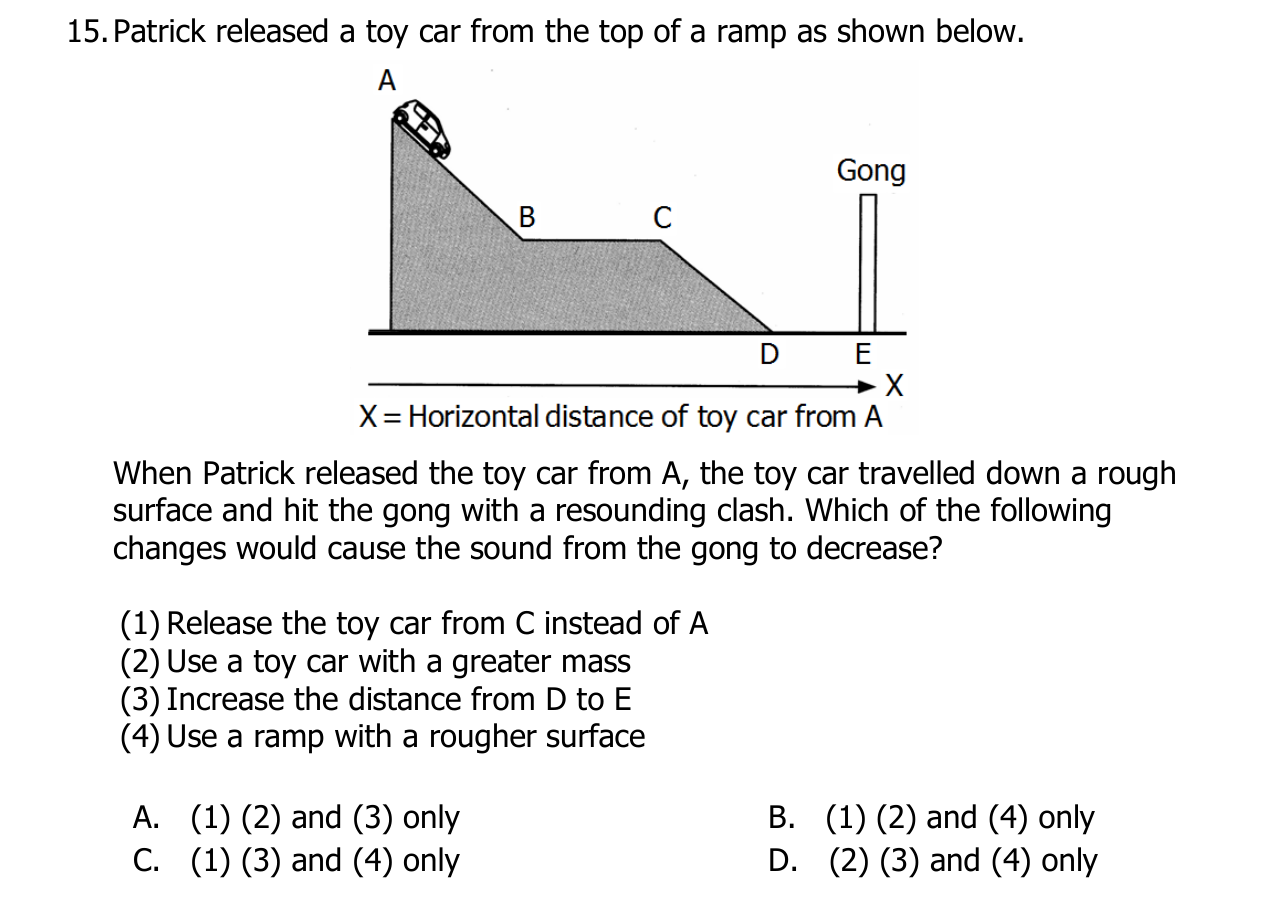
Question 15

Patrick released a toy car from the top of a ramp as shown below.
When Patrick released the toy car from A, the toy car travelled down a rough
surface and hit the gong with a resounding clash. Which of the following
changes would cause the sound from the gong to decrease?
(1) Release the toy car from C instead of A
(2) Use a toy car with a greater mass
(3) Increase the distance from D to E
(4) Use a ramp with a rougher surface
A. (1) (2) and (3) only
B. (1) (2) and (4) only
C. (1) (3) and (4) only
D. (2) (3) and (4) only

Question illustration
  1. (1) (2) and (3) only
  2. (1) (2) and (4) only
  3. (1) (3) and (4) only
  4. (2) (3) and (4) only

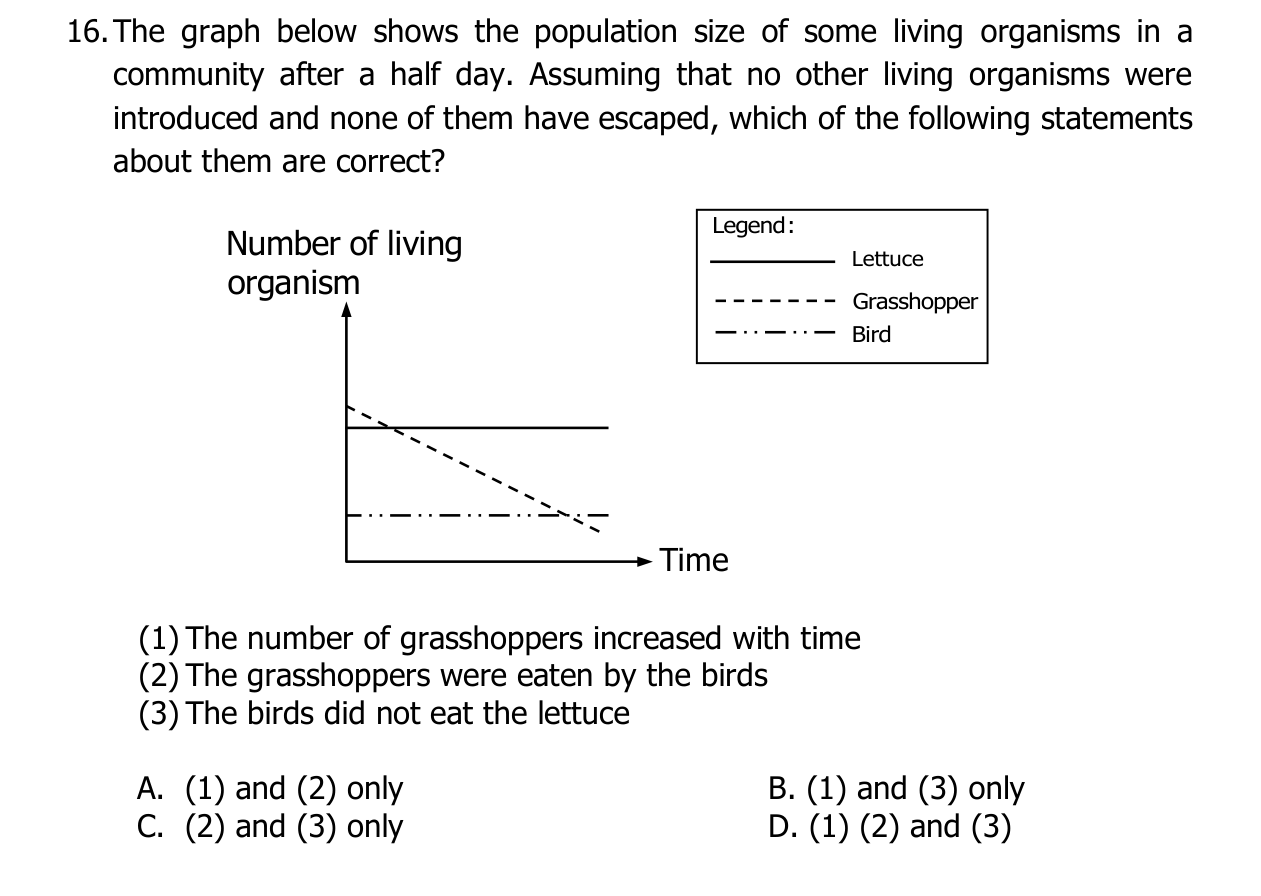
Question 16

The graph below shows the population size of some living organisms in a
community after a half day. Assuming that no other living organisms were
introduced and none of them have escaped, which of the following statements
about them are correct?
(1) The number of grasshoppers increased with time
(2) The grasshoppers were eaten by the birds
(3) The birds did not eat the lettuce
A. (1) and (2) only
B. (1) and (3) only
C. (2) and (3) only
D. (1) (2) and (3)
Legend:
Lettuce
Grasshopper
Bird
Number of living
organism
Time

Question illustration

Question 17

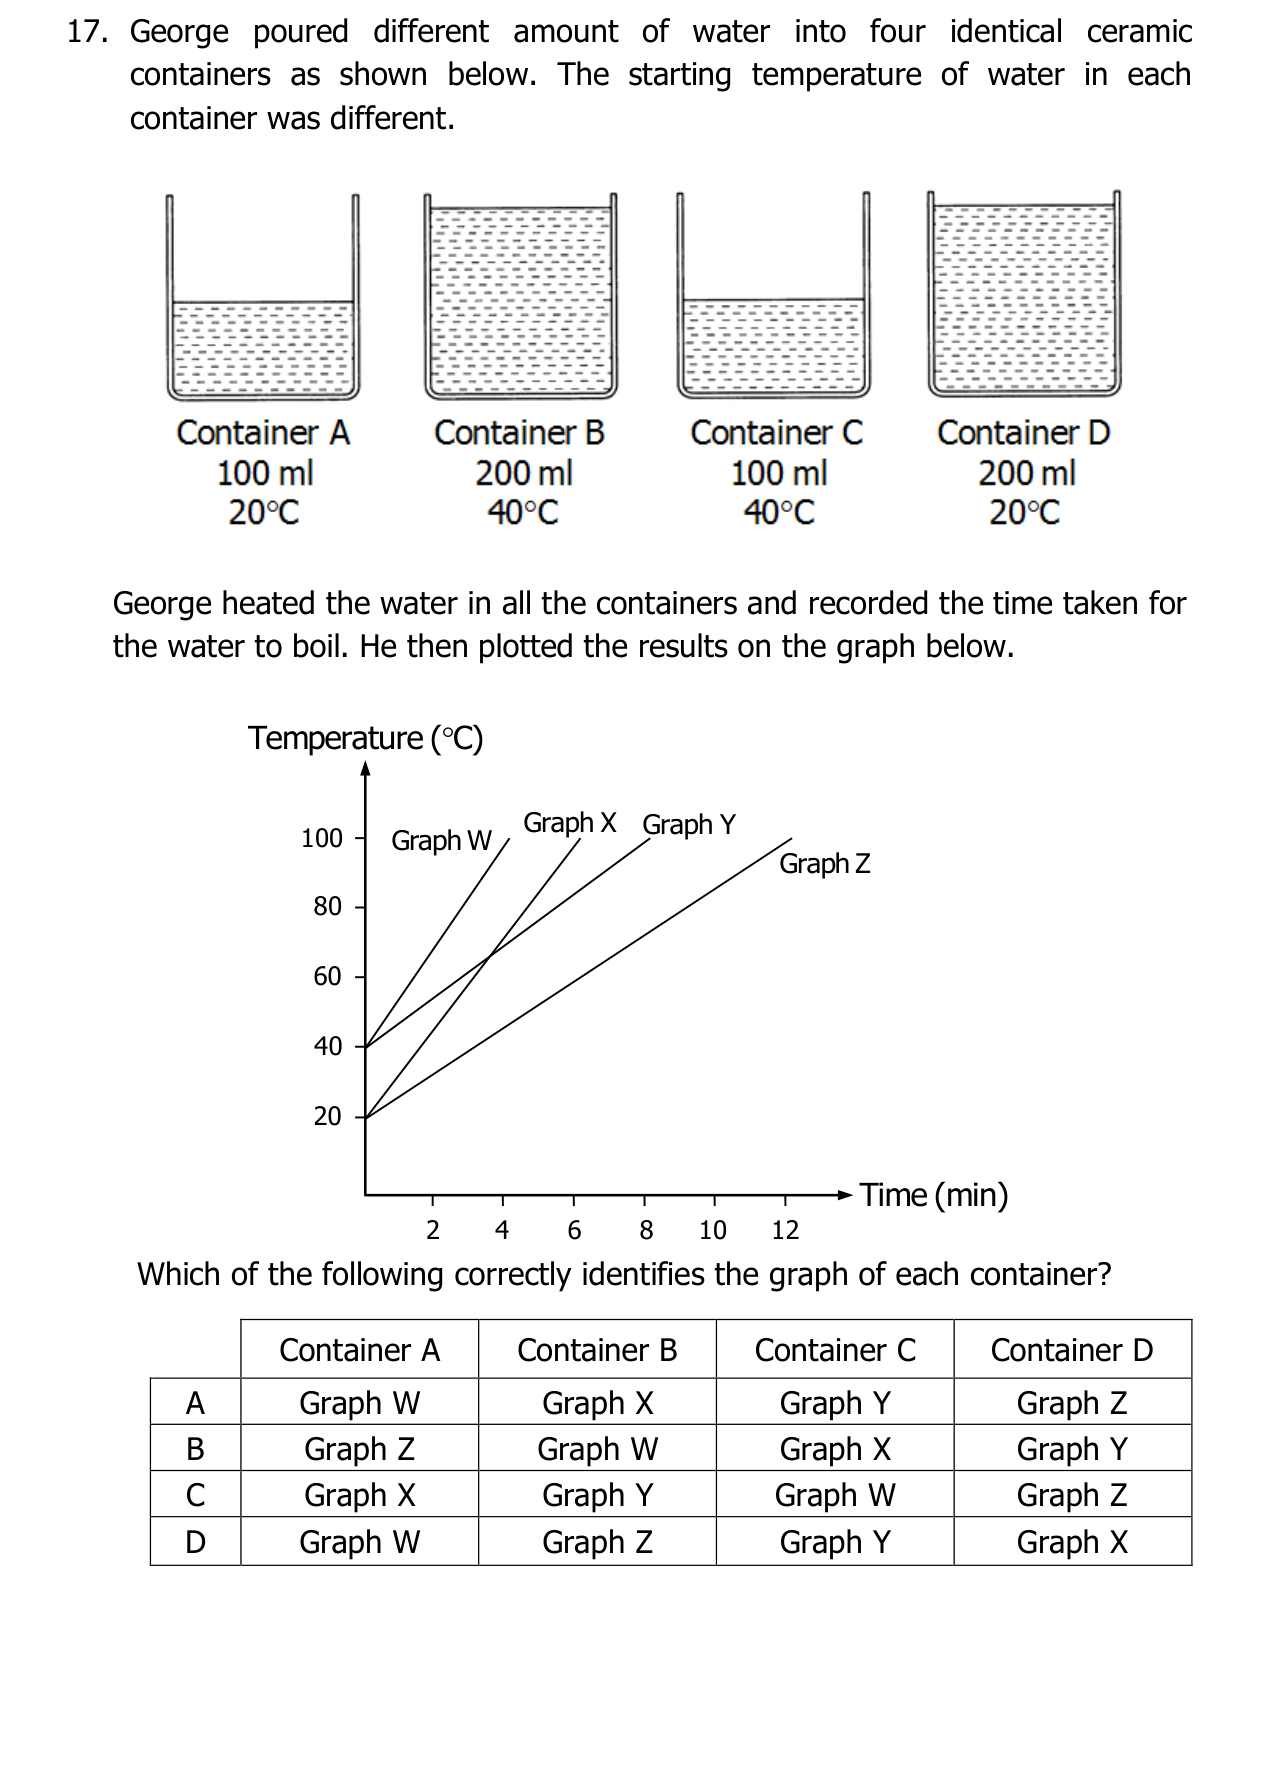
George poured different amount of water into four identical ceramic
containers as shown below. The starting temperature of water in each
container was different.
George heated the water in all the containers and recorded the time taken for
the water to boil. He then plotted the results on the graph below.
Which of the following correctly identifies the graph of each container?
Container A
Container B
Container C
Container D
A
Graph W
Graph X
Graph Y
Graph Z
B
Graph Z
Graph W
Graph X
Graph Y
C
Graph X
Graph Y
Graph W
Graph Z
D
Graph W
Graph Z
Graph Y
Graph X
°
Temperature ( C)
Graph W
Graph X
Graph Y
Graph Z
100
80
60
40
20
Time (min)
2
4
6
8
10
12

Question illustration
  1. W, X, Y, Z
  2. Z, W, X, Y
  3. X, Y, W, Z
  4. W, Z, Y, X

Question 18

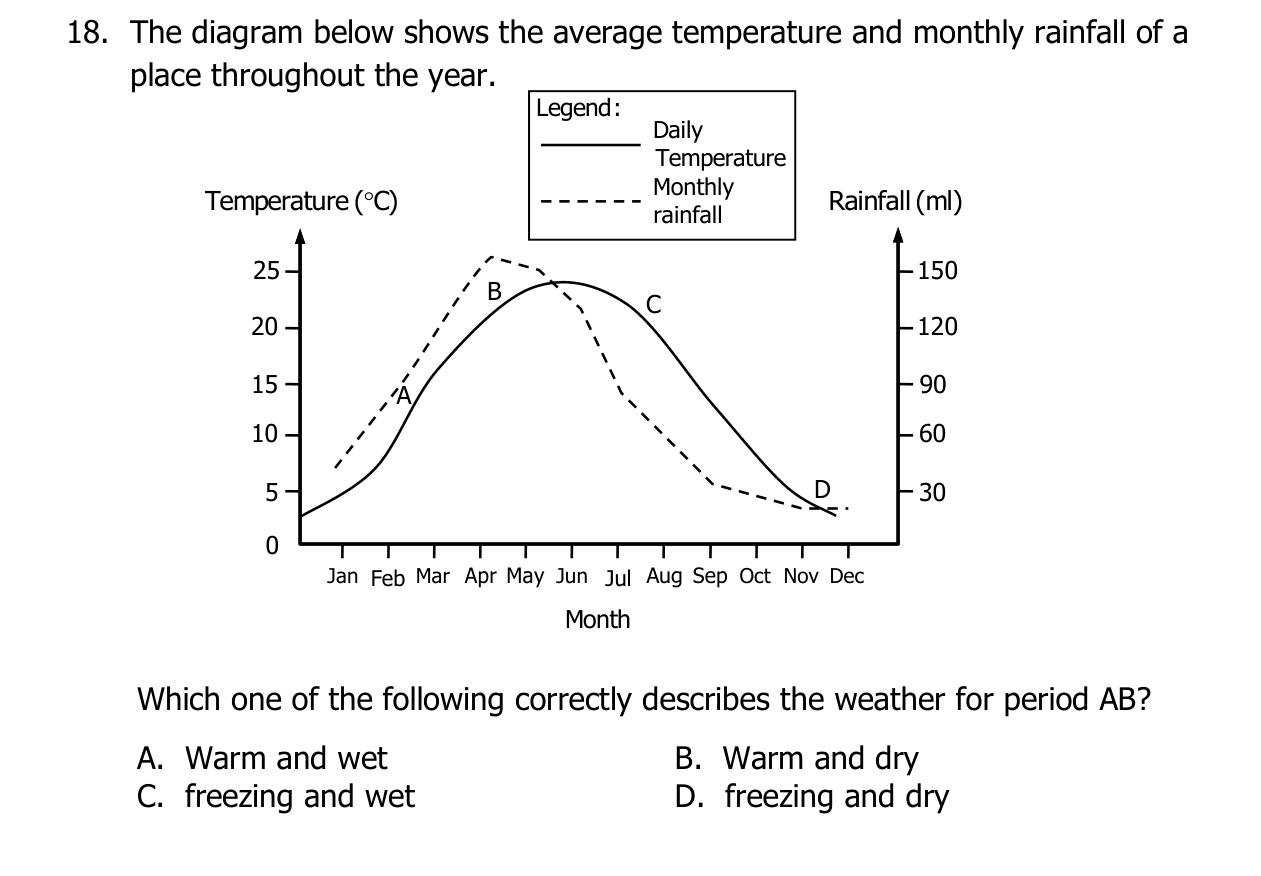
The diagram below shows the average temperature and monthly rainfall of a
place throughout the year.
Which one of the following correctly describes the weather for period AB?
A. Warm and wet
B. Warm and dry
C. freezing and wet
D. freezing and dry
°
Temperature ( C)
Rainfall (ml)
25
20
15
10
5
0
Jan Feb Mar Apr May Jun Jul Aug Sep Oct Nov Dec
150
120
90
60
30
Month
Legend:
Daily
Temperature
Monthly
rainfall
A
B
C
D

Question illustration
  1. Warm and wet
  2. Warm and dry
  3. freezing and wet
  4. freezing and dry