Skip to content / Đến nội dung
ThichHocToan.com

IMSO 2004 Science — Taiwan Experiments I–IV

Question 1

Source header: International Mathematics and Science Olympiad for Primary Schools (IMSO) 2004 · Science Contest in Taiwan. Fields: Name, School, Grade, ID number. No round or duration is printed. This combined four-experiment package uses one shared 120-minute fallback, not a historical time claim.

## Experiment I: Magic of Light

**Procedure (all six source steps):**

1\. Put the flashlight in front of the graph-paper screen.

2\. Turn on the flashlight. Observe the corner-shaped image shown in the original figure on the screen.

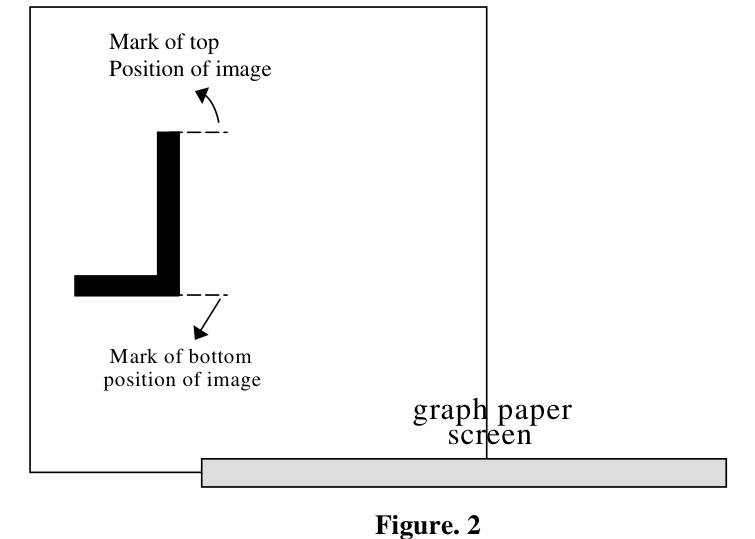
3\. Mark its top and bottom positions on the screen graph paper (Figure 2).

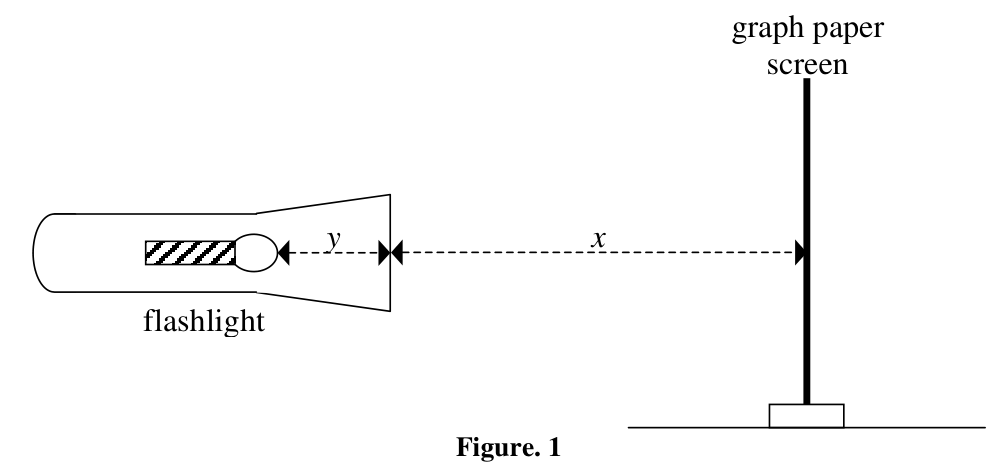
4\. Measure distance $x$. Figure 1 illustrates $x=20\,\mathrm{cm}$; $y$ is the internal source-to-object distance.
Question illustration

Question illustration

5\. Repeat with three different distances by moving the screen.

6\. Draw all the marks, including their distances, on another graph paper. The source supplies these results (image heights in cm, as used in the handwritten solution):

| Position | Distance x (cm) | Image height (cm) |
|---|---|---|
| First | 15 | 3.20 |
| Second | 13 | 2.88 |
| Third | 5 | 1.60 |

**Problem 1 (25 points).** Calculate the height of the image at $x=10\,\mathrm{cm}$.

**Problem 2 (25 points).** Calculate distance $y$ in Figure 1.

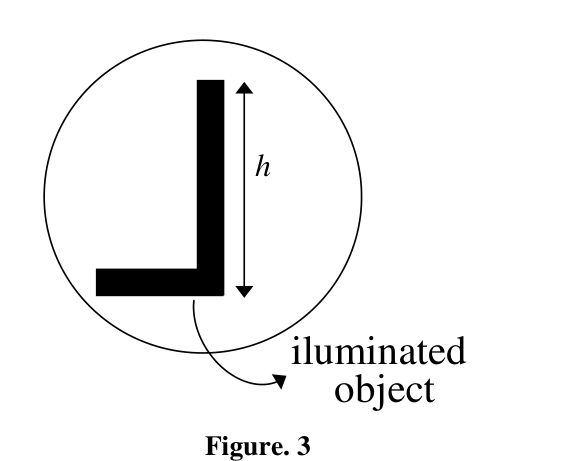
**Problem 3 (25 points).** Calculate the height $h$ of the object on the flashlight (Figure 3), without using a ruler.
Question illustration

**Problem 4 (25 points).**

(a) Arrange the provided materials so you can see the image in the laterally opposite position. Materials: two plane mirrors, two convex lenses, two concave lenses, two convex mirrors and two concave mirrors.

(b) Draw on the supplied paper the positions of the mirrors, screen and ray path.

Question illustration

Figure glossary: graph paper screen; flashlight; top/bottom marks of the image; illuminated object. The original figures and target orientation are preserved. The table contains supplied data, not new measurements by this edition.
Question 2

Source header: International Mathematics and Science Olympiad for Primary Schools (IMSO) 2004 · Science Contest in Taiwan. Fields: Name, School, Grade, ID number. No round or duration is printed. This combined four-experiment package uses one shared 120-minute fallback, not a historical time claim.

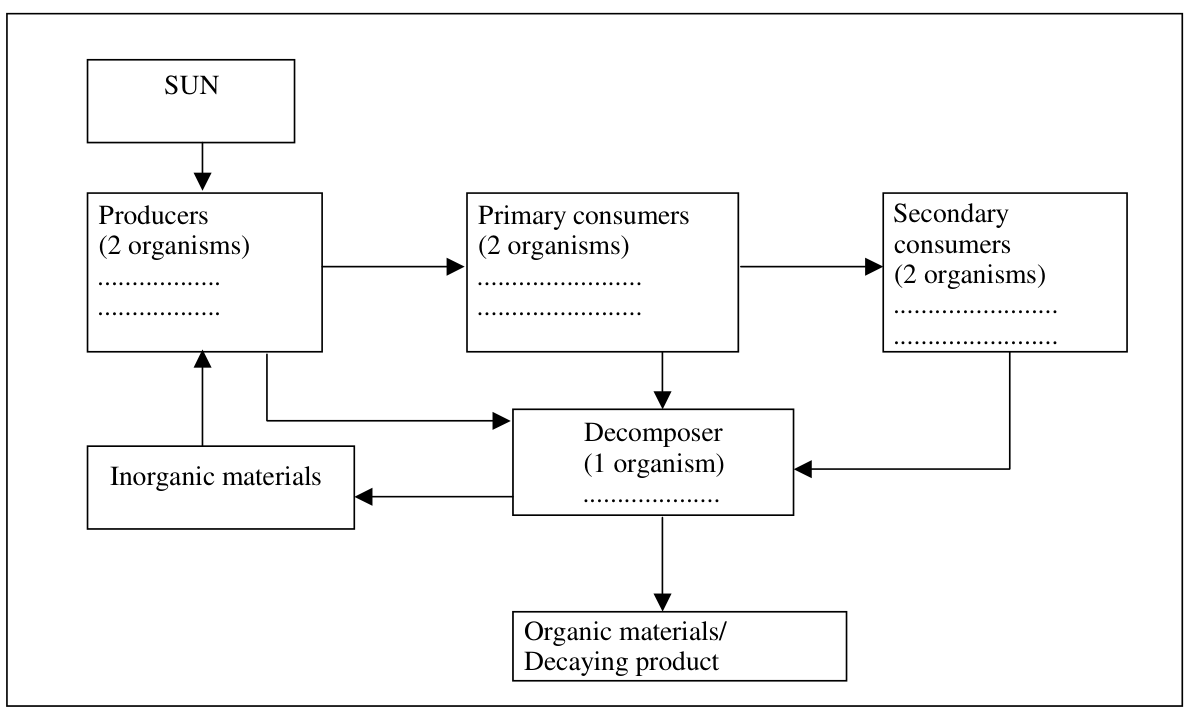
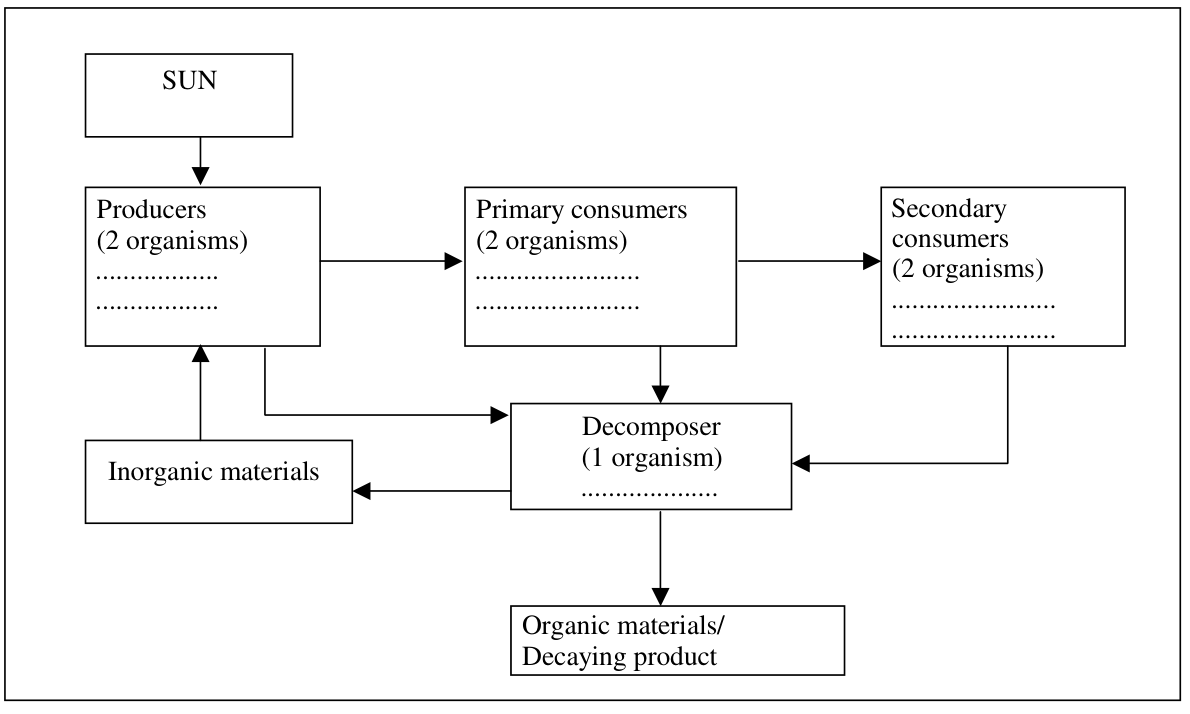
## Experiment II: Food chains

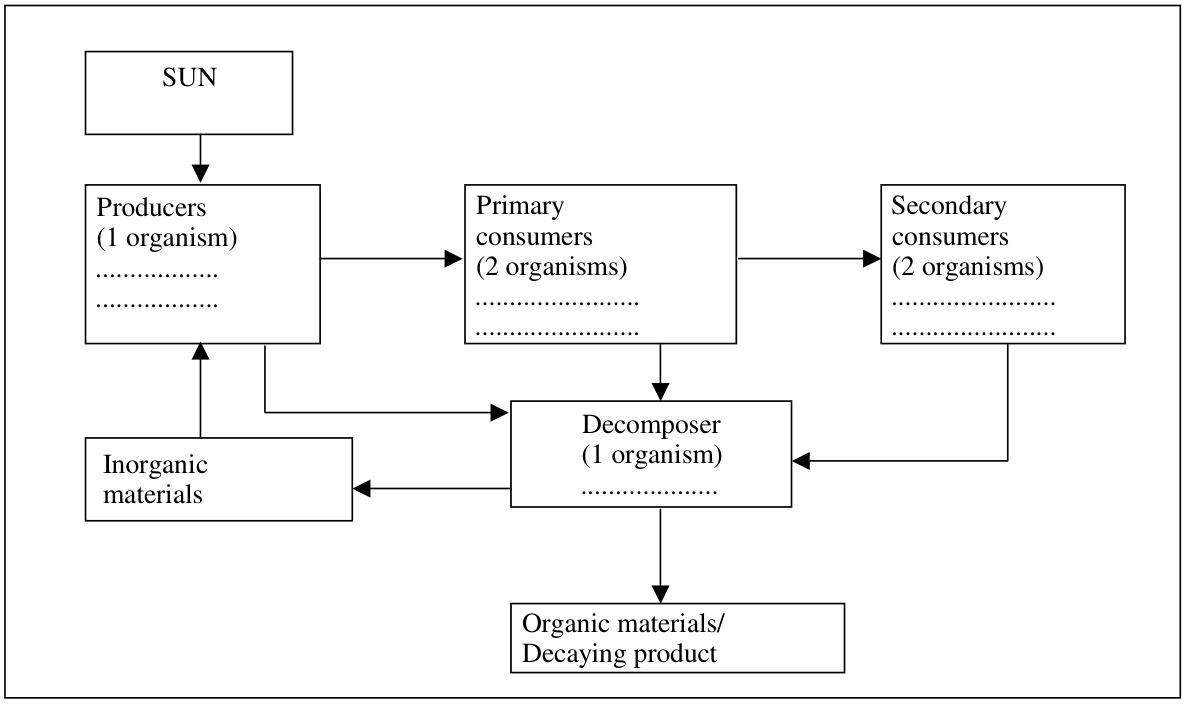
**Original instruction:** Write the correct biological species terms shown in the **PICTURES OF EXPERIMENT II** into the following food chains.

**Source gap:** that separate organism-picture sheet is not among the supplied files, and no species-answer key for Experiment II was supplied. The task remains incomplete until those pictures are recovered. Do not substitute invented species as if they were the requested pictured organisms.

**A. Food chain in the rice field:** producers (2 organisms), primary consumers (2), secondary consumers (2), decomposer (1).

Question illustration

**B. Food chain in the marsh (swamp):** producers (2 organisms), primary consumers (2), secondary consumers (2), decomposer (1).

Question illustration

**C. Food chain in the “TROPICAL RAI”** (heading visibly truncated in the original; likely tropical rainforest): producers (**1 organism**, despite two dotted lines), primary consumers (2), secondary consumers (2), decomposer (1).

Question illustration

The diagrams also contain SUN, inorganic materials and organic materials/decaying product. Preserve all arrows and blanks as printed. There are 20 requested organism slots:7+7+6. No points are printed for this experiment; one editorial point per requested slot gives 20, solely as a transparent marking allocation once the missing pictures become available.

Question 3

Source header: International Mathematics and Science Olympiad for Primary Schools (IMSO) 2004 · Science Contest in Taiwan. Fields: Name, School, Grade, ID number. No round or duration is printed. This combined four-experiment package uses one shared 120-minute fallback, not a historical time claim.

## Experiment III: Black Box Electric Circuit

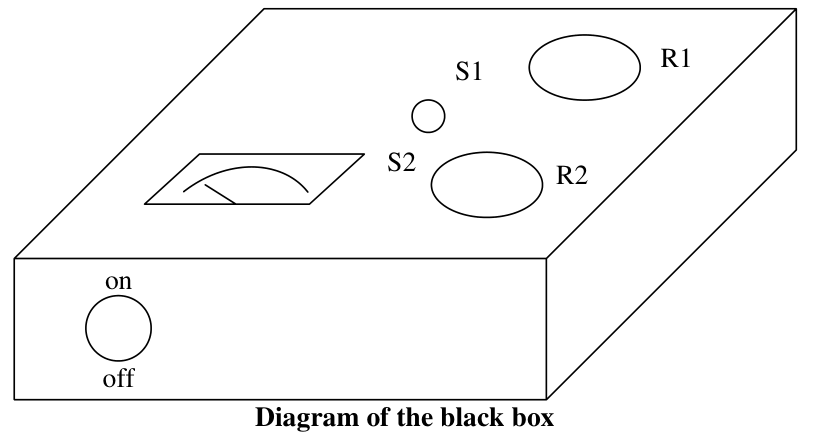
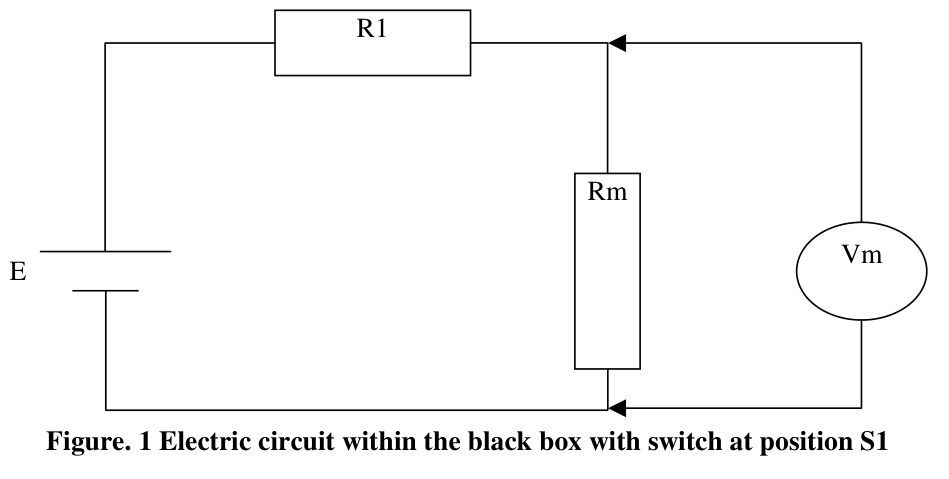
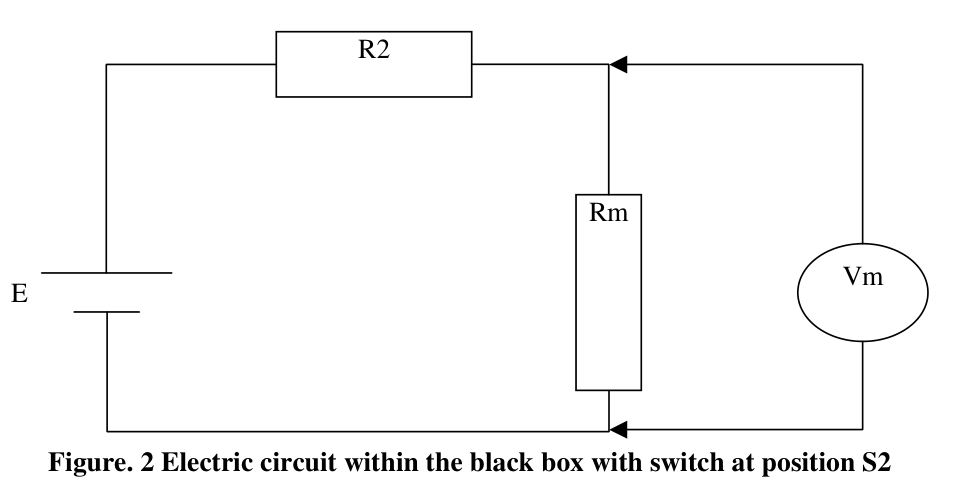
A black box containing an electric circuit is provided. A two-position switch selects the circuit: S1 uses Figure 1; S2 uses Figure 2. A voltmeter $V_m$ measures the voltage across resistor $R_m$. The source lists measured voltages $0,2.5,3,3.75,\ldots,15\,\mathrm V$.

Question illustration

Question illustration

Question illustration

**A. Set the switch to S1.** The source says “Resistor is varied as shown in.” (unfinished sentence).

A1. As $R_1$ changes, read $V_m$ in column 3 of Table 1.

A2. Choose the right answer. Theoretically, current through $R_1$ is: (a) less than current through $R_m$; (b) equal to it; (c) more than it; (d) less than or equal to it; (e) more than or equal to it. **13 points.**

A3. With $R_m$ and battery voltage constant, increasing $R_1$ makes: (a) voltage $V_{R1}$ increase; (b) $V_{R1}$ decrease; (c) $V_m$ increase; (d) $V_m$ decrease; (e) $V_{R1}$ remain constant; (f) $V_{Rm}$ remain constant. The source says “choose the right answer.” **6 points.**

A4. Fill Table 1 by calculating current through $R_1$. **3 points.** Preserve the two blank calculated columns:

| Rotary position | R1 (ohm) | Vm (V), supplied | VR 1=E−Vm (V) | IR 1=VR 1/R1 (mA) |
|---|---|---|---|---|
|1|500|2.50|____|____|
|2|400|3.00|____|____|
|3|300|3.75|____|____|
|4|200|5.00|____|____|
|5|100|7.50|____|____|
|6|0|15.00|____|____|

A5. Draw $V_m$ versus current through $R_1$. **6 points.**

A6. The slope (voltage difference divided by current difference) equals ______. **5 points.**

A7. What does the slope represent? (a) $R_1$; (b) $R_2$; (c) $R_m$; (d) current through $R_1$; (e) current through $R_2$; (f) battery voltage $E$. **5 points.**

A8. Calculate current through $R_1$ when $R_1=0$. **6 points.**

**B. Set the switch to S2.** Unknown $R_2$ varies with its rotary-switch position.

B1. Read the supplied voltmeter values in column 2 of Table 2.

B2. Calculate voltage across $R_2$ and fill column 3. **6 points.**

**C. Data Analysis.** Estimate $R_2$ from the data and enter the results in Table 2. **24 points.**

| Rotary position | Vm (V), supplied | VR 2=E−Vm (V) | R2 (ohm) |
|---|---|---|---|
|1|12.50|____|____|
|2|10.00|____|____|
|3|7.50|____|____|
|4|6.00|____|____|
|5|5.00|____|____|
|6|3.00|____|____|

Original labels: on/off; S1/S2; R1/R2/Rm; Vm; E. All listed readings are source-provided, not newly observed. Source subpart marks sum to 74.

Question 4

Source header: International Mathematics and Science Olympiad for Primary Schools (IMSO) 2004 · Science Contest in Taiwan. Fields: Name, School, Grade, ID number. No round or duration is printed. This combined four-experiment package uses one shared 120-minute fallback, not a historical time claim.

## Experiment IV: Our neightbour MARS [source spelling]

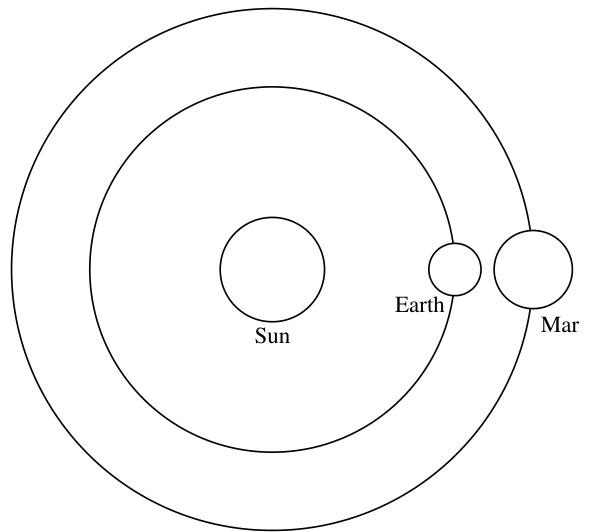
The source states: “On August 27th,2003, Mars was in the opposition (the closest position to the Earth).” This event is shown in the following original figure:

Question illustration

The next opposition can be estimated using

$$\frac1{P_{\mathrm{opp}}}=\frac1E-\frac1M.$$

$P_{\mathrm{opp}}$ is the period between oppositions of Mars; Earth's revolution period is $E=365$ days; Mars's is $M=687$ days.

1\. Find the period of opposition of Mars. **5 points.**

2 a\. How many revolutions should Mars make around the Sun to reach the next opposition? **3 points.**

2 b\. How many revolutions should Earth make around the Sun to reach the next opposition with Mars? **4 points.**

3\. Predict approximately when the next opposition will occur: date, month and year. **8 points.**

4\. Draw the diagram of the next opposition. **6 points.**

Original figure labels: Sun; Earth; “Mar” (truncated Mars). Source wording and starting date are retained for the calculation; their astronomical limitations are explained in the solution. Total 26 printed points.