Question 9
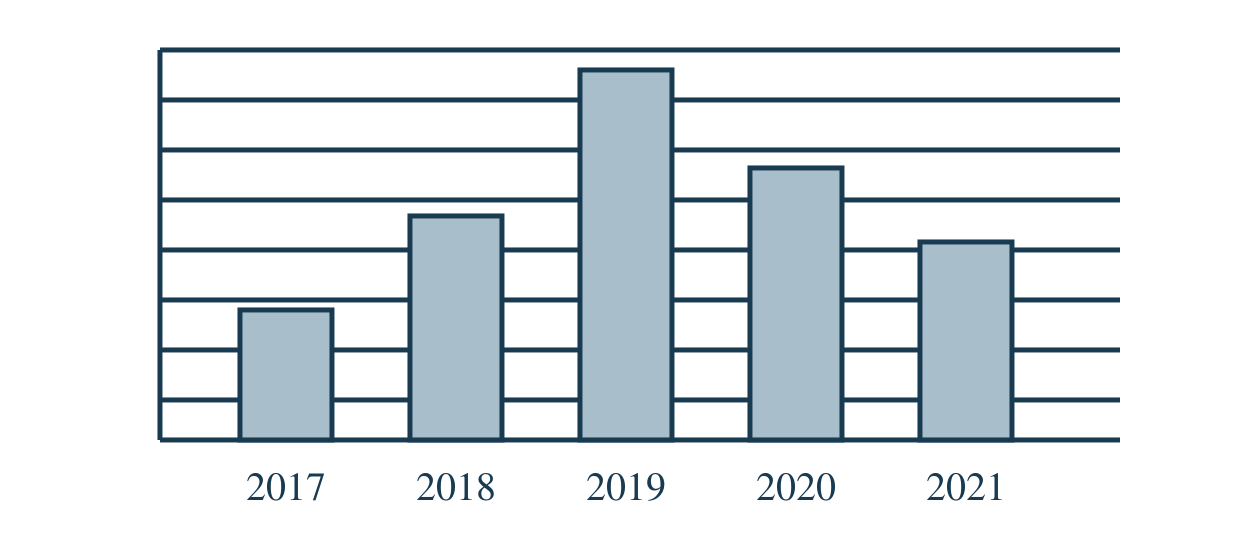
The bar chart shows the number of notebooks sold by a company over several years. In each of 2018 and 2019, sales increased by 60% over the preceding year. In each of 2020 and 2021, sales decreased by 25% from the preceding year. The company sold 30 800 more notebooks in 2021 than in 2017. How many notebooks did it sell in 2021?