Question 4
Double bar graph show the number of students in MN high school who did worked part time while studying. Use the graph to solve the problems given below the graph.
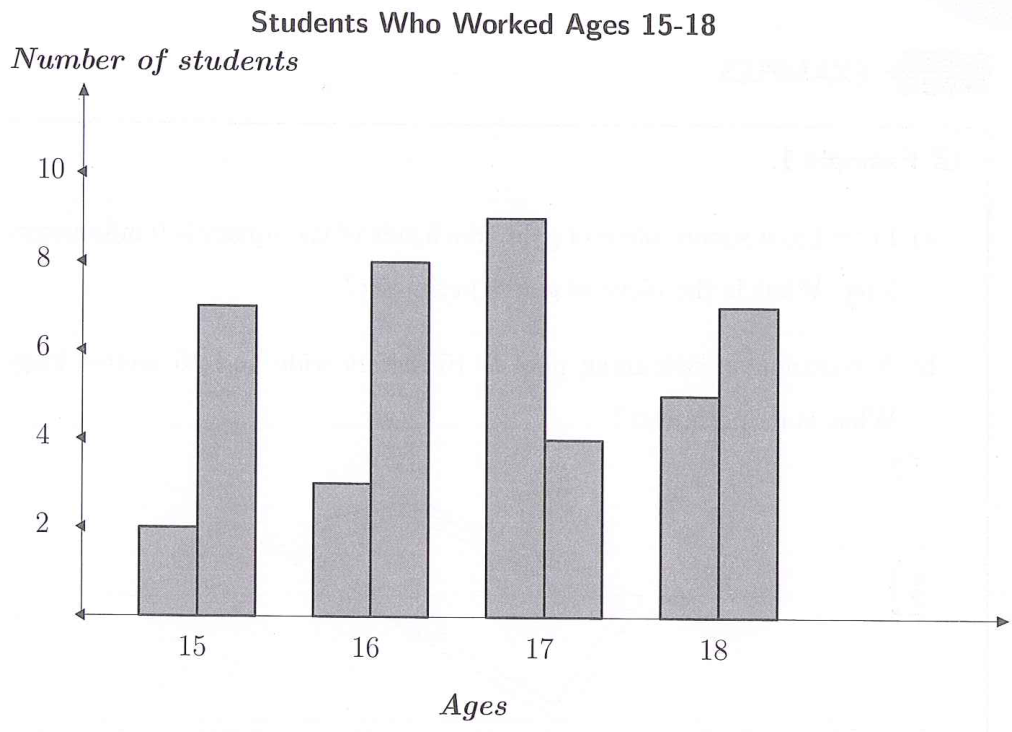
a) What is the difference between the number of working and non-working students in the group of 15?
b) Which age group worked the most (in terms of number of students)?
Self-study clarification and conditional input (editorial): the original chart has no legend identifying working students. Answer part (a), then give part (b) for each possible series. Enter three numbers separated by semicolons: difference at age 15; age with the largest left bar; age with the largest right bar. This input preserves both conditional interpretations and does not assign a missing legend.
**Editorial input note:** Use no spaces before or after semicolons.
a) What is the difference between the number of working and non-working students in the group of 15?
b) Which age group worked the most (in terms of number of students)?
Self-study clarification and conditional input (editorial): the original chart has no legend identifying working students. Answer part (a), then give part (b) for each possible series. Enter three numbers separated by semicolons: difference at age 15; age with the largest left bar; age with the largest right bar. This input preserves both conditional interpretations and does not assign a missing legend.
**Editorial input note:** Use no spaces before or after semicolons.