Question 3
A study was conducted to investigate the relationship between transpiration and
changes in a tree's stem diameter. A dendrograph was used to continuously
measure the stem's diameter over a period of time, as shown in the figure below.
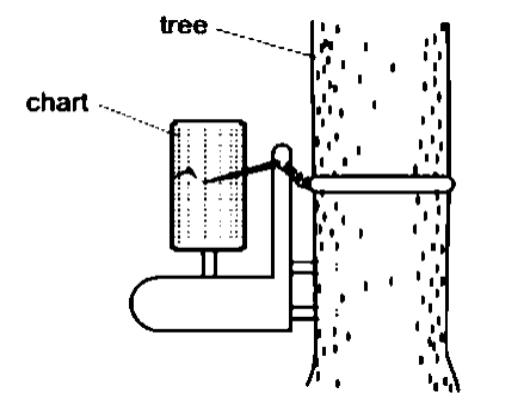
Fig. 1
Data were collected in the following table:
| Time of the day | Stem diameter (mm) |
|---|---:|
| 6:00 | 4.6 |
| 12:00 | 4.0 |
| 18:00 | 4.6 |
| 24:00 | 5.0 |
| 6:00 | 4.6 |
| 12:00 | 4.0 |
| 18:00 | 4.6 |
| 24:00 | 5.0 |
| 6:00 | 4.6 |
a. Using the provided data, create a line graph that illustrates the change in the
tree's stem diameter over time. [2 marks]
b. Using the provided data, describe the overall pattern of change in the tree's
stem diameter over the 24-hour period. [2 marks]
c. Provide a scientific explanation for the pattern observed during the night.
[2 marks]
changes in a tree's stem diameter. A dendrograph was used to continuously
measure the stem's diameter over a period of time, as shown in the figure below.
Fig. 1
Data were collected in the following table:
| Time of the day | Stem diameter (mm) |
|---|---:|
| 6:00 | 4.6 |
| 12:00 | 4.0 |
| 18:00 | 4.6 |
| 24:00 | 5.0 |
| 6:00 | 4.6 |
| 12:00 | 4.0 |
| 18:00 | 4.6 |
| 24:00 | 5.0 |
| 6:00 | 4.6 |
a. Using the provided data, create a line graph that illustrates the change in the
tree's stem diameter over time. [2 marks]
b. Using the provided data, describe the overall pattern of change in the tree's
stem diameter over the 24-hour period. [2 marks]
c. Provide a scientific explanation for the pattern observed during the night.
[2 marks]