Question 2
The graph below shows the results of the effect of light intensity on a plant’s rate
of photosynthesis at two different temperatures, T. Curve A was obtained from a
plant kept at lower temperature, while curve B was obtained from a plant kept at
a higher temperature.
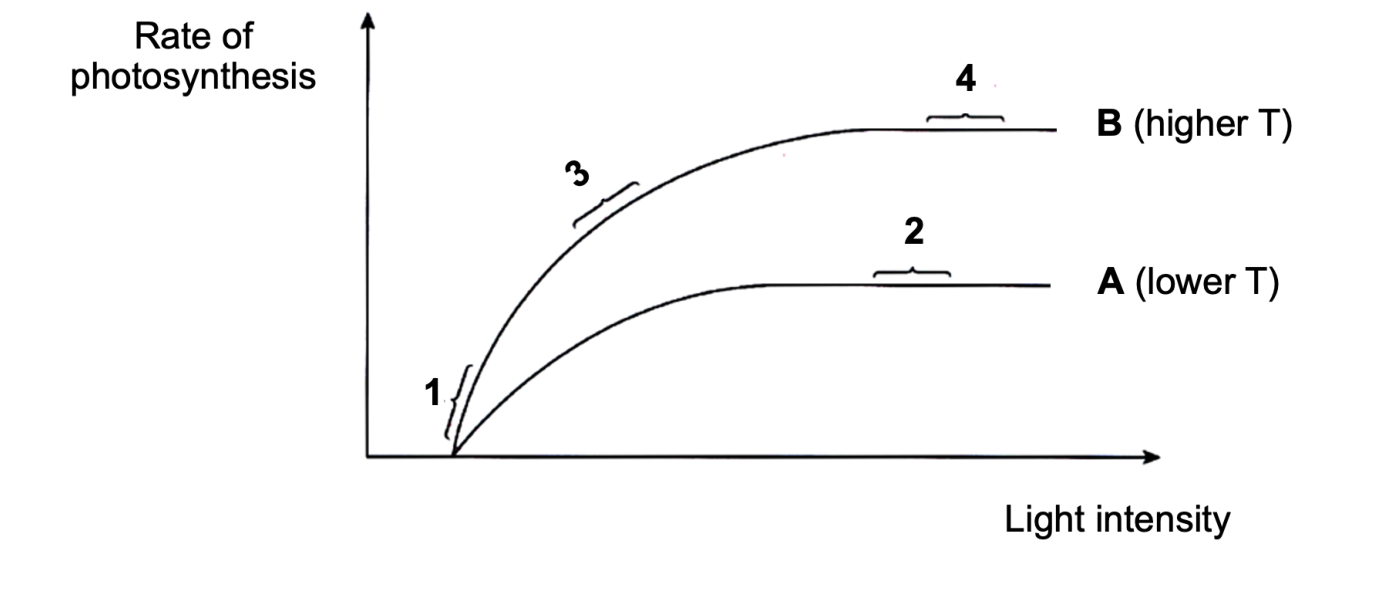
a. State the factor which was affecting the rate of photosynthesis at regions 1 and
3 on the graph. Justify your answer. [2 marks]
b. Explain what influences the data gathered at region 2. [2 marks]
c. Other than the factor which you have mentioned in your answer for Question
2a, state ONE other factor that affects the rate of photosynthesis. [1 mark]
of photosynthesis at two different temperatures, T. Curve A was obtained from a
plant kept at lower temperature, while curve B was obtained from a plant kept at
a higher temperature.
a. State the factor which was affecting the rate of photosynthesis at regions 1 and
3 on the graph. Justify your answer. [2 marks]
b. Explain what influences the data gathered at region 2. [2 marks]
c. Other than the factor which you have mentioned in your answer for Question
2a, state ONE other factor that affects the rate of photosynthesis. [1 mark]