Question 25
Original source text (the original panel preserves all diagram labels, tables and choices):
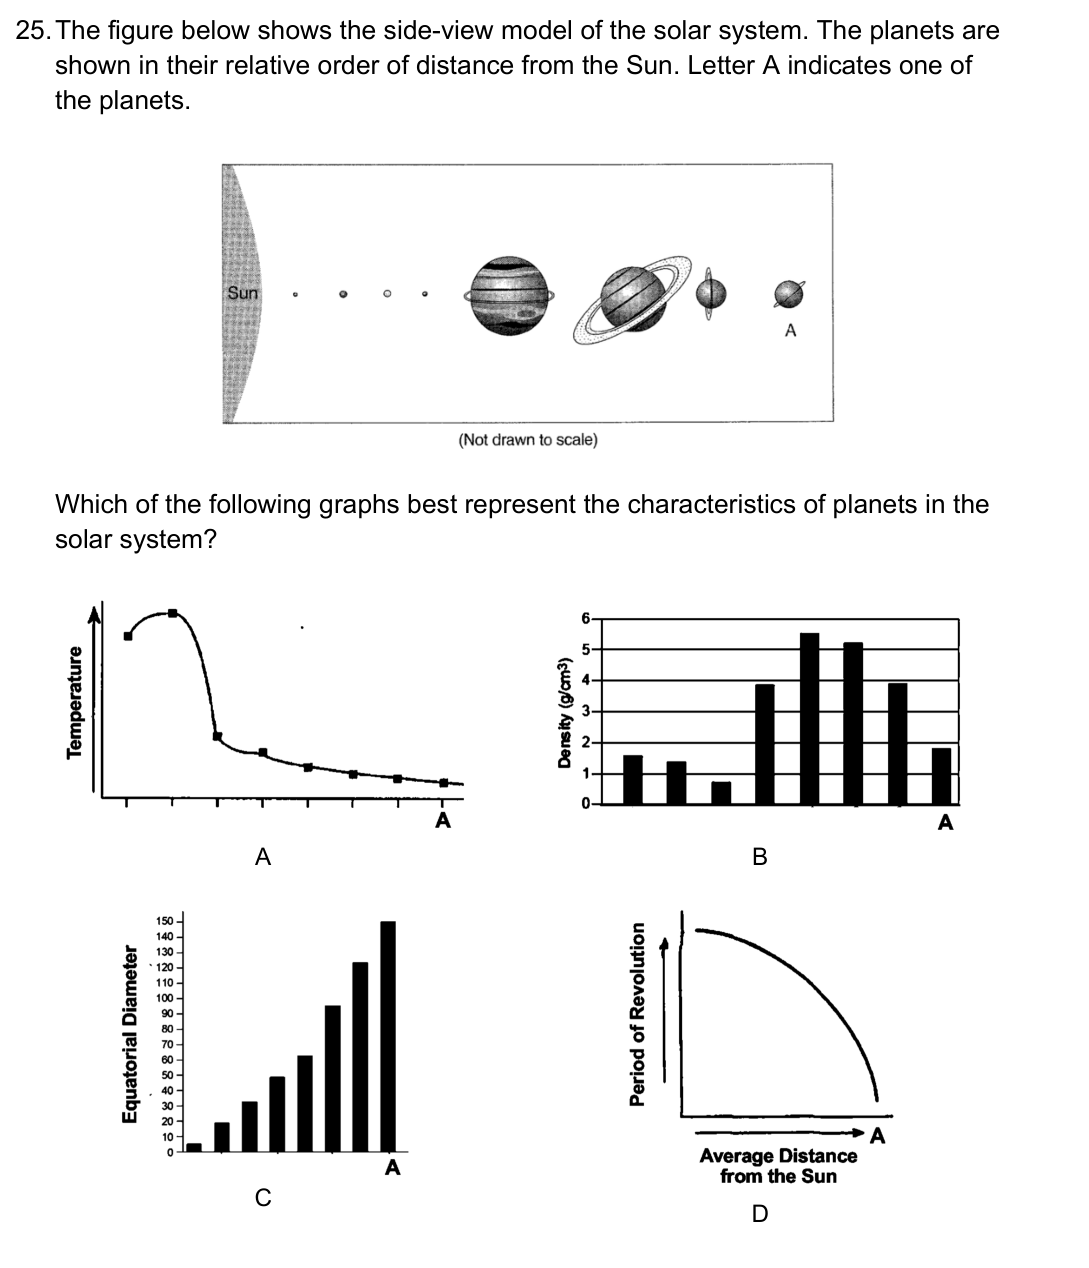
The figure below shows the side-view model of the solar system. The planets are
shown in their relative order of distance from the Sun. Letter A indicates one of
the planets.
Which of the following graphs best represent the characteristics of planets in the
solar system?
A B
C
D
The figure below shows the side-view model of the solar system. The planets are
shown in their relative order of distance from the Sun. Letter A indicates one of
the planets.
Which of the following graphs best represent the characteristics of planets in the
solar system?
A B
C
D