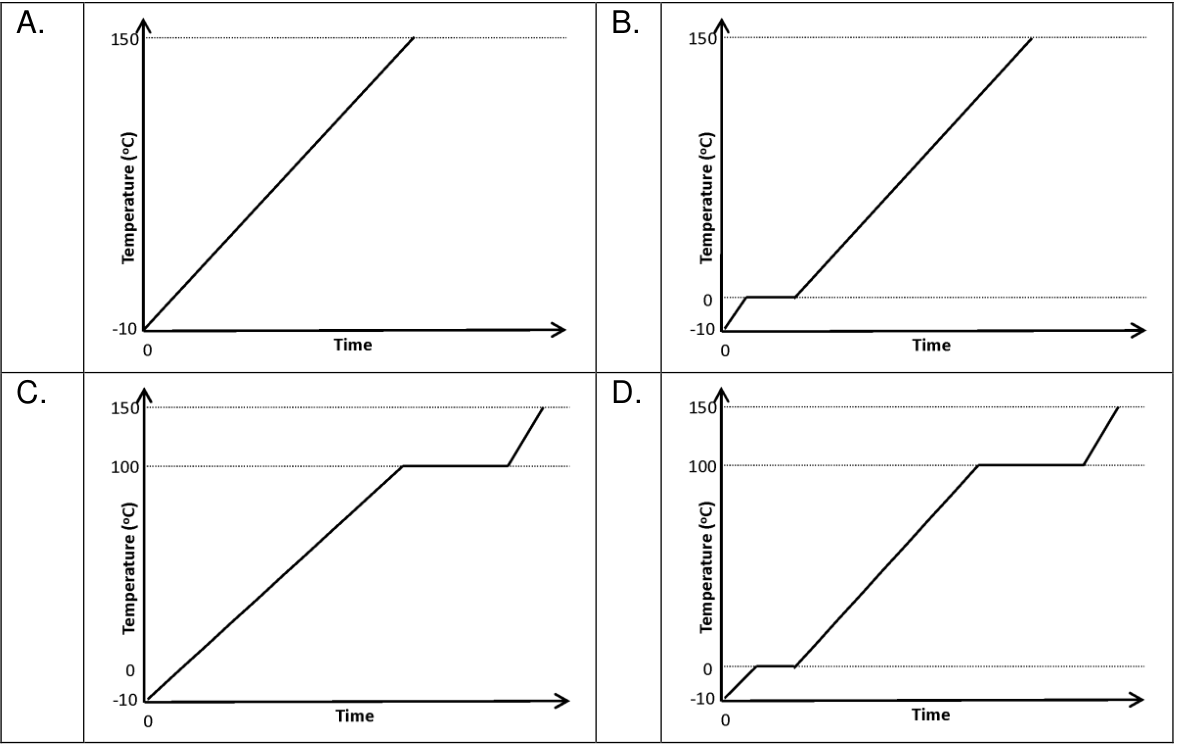
Question 23Ice initially at −10°C is heated at a steady rate until the sample reaches 150°C. Which temperature–time graph A–D represents the result? Graph AGraph BGraph CGraph D