Question 10
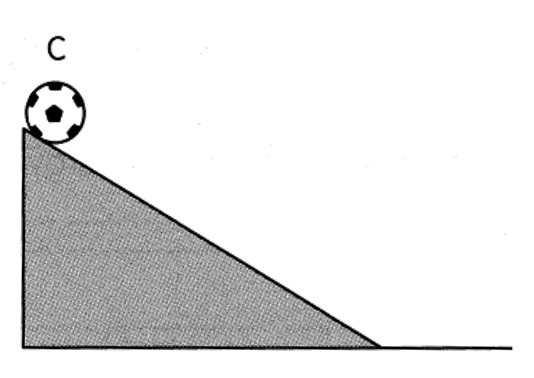
The diagram below shows a ball at the top of a ramp (position C).
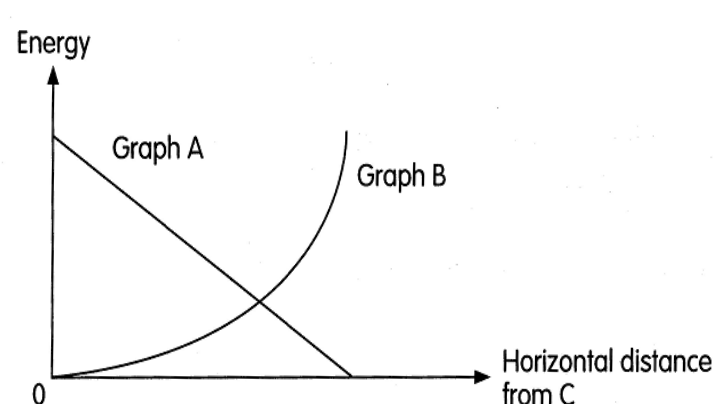
The graph below shows the potential and kinetic energy of the ball as it rolls down the ramp.
(a) Which graph represents the kinetic energy of the ball? Which graph represents the potential energy of the ball? [0.5 points each]
Kinetic energy: ______
Potential energy: ______
(b) Mark “X” on the graph to show the point where the ball possesses the same amount of kinetic and potential energy. [1 point]
The graph below shows the potential and kinetic energy of the ball as it rolls down the ramp.
(a) Which graph represents the kinetic energy of the ball? Which graph represents the potential energy of the ball? [0.5 points each]
Kinetic energy: ______
Potential energy: ______
(b) Mark “X” on the graph to show the point where the ball possesses the same amount of kinetic and potential energy. [1 point]