Question 9
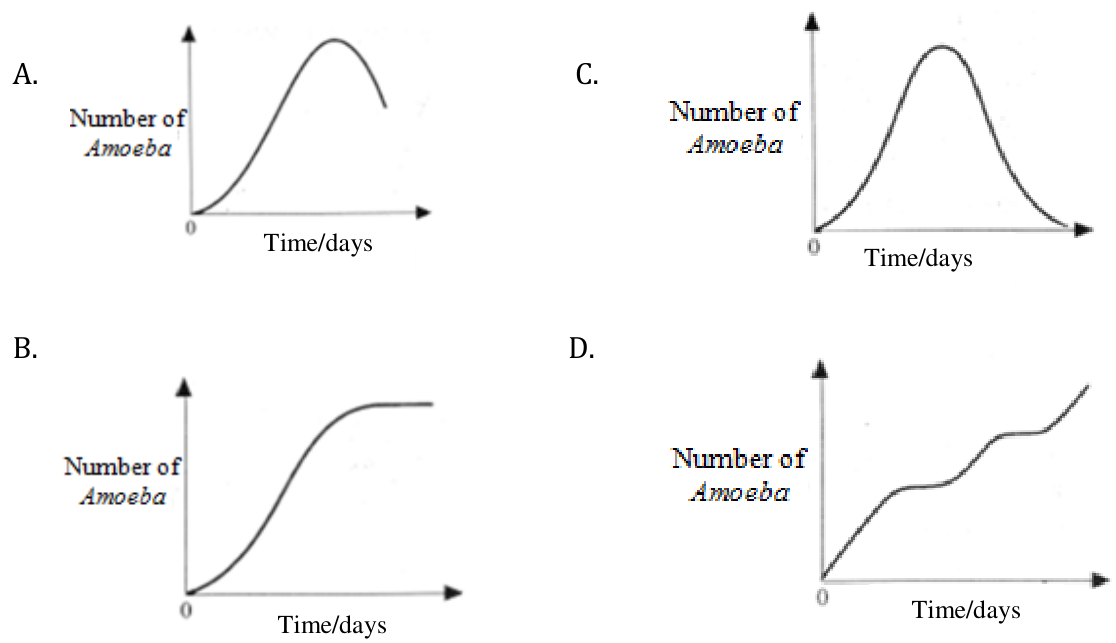
In a culture of Amoeba in a laboratory, environmental condition is maintained constant at 29 °C and food is constantly added, while toxic waste is discarded. Which of the following graphs shows the pattern growth of that Amoeba population?
A. Graph A
B. Graph B
C. Graph C
D. Graph D
A. Graph A
B. Graph B
C. Graph C
D. Graph D