Question 12
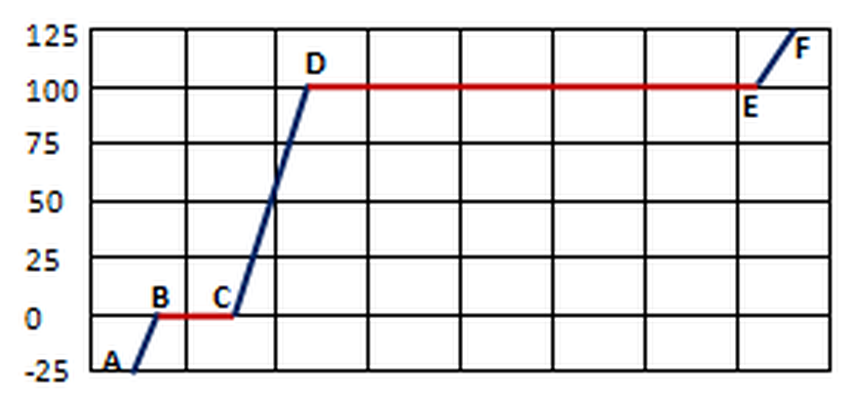
A heating curve is a graph of heat added versus temperature. The figure below shows the heating curve for ice at -25°C to steam at 125°C. Line segment AB represents the heating of ice from -25°C to 0°C and line segment BC represents the melting of ice. Addition of heat increases the temperature of the water up to 100°C represented by line segment CD. What does line segment DE and EF represents.