Question 22
The graph shows the population of Escherichia coli. Explain its growth pattern at each specified point.
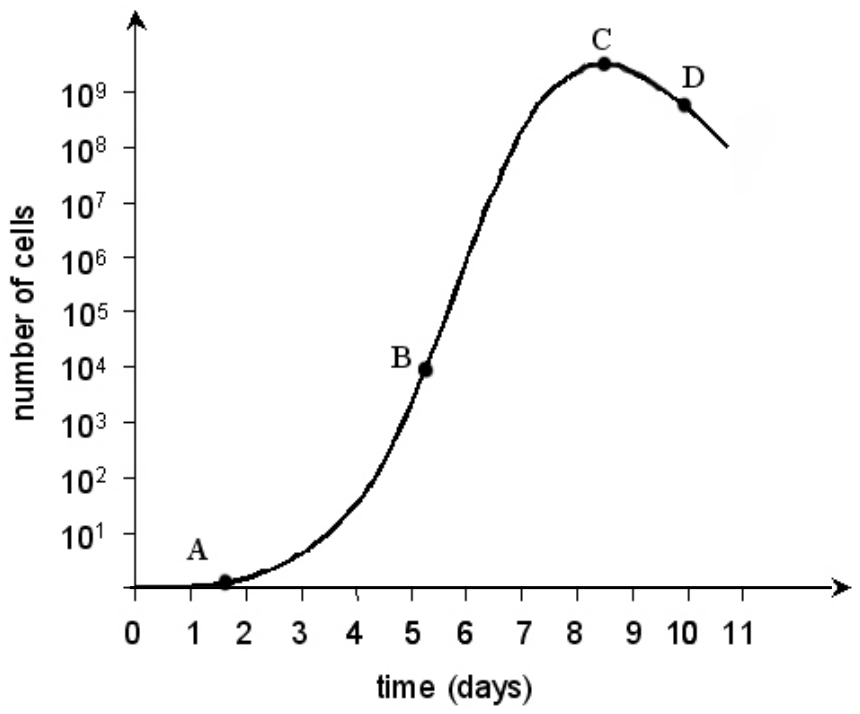
Labels: number of cells; time (days); A, B, C, D.
a) Point A. (1 point)
b) Point B. (1 point)
c) Point C. (1 point)
d) Point D. (1 point)
Labels: number of cells; time (days); A, B, C, D.
a) Point A. (1 point)
b) Point B. (1 point)
c) Point C. (1 point)
d) Point D. (1 point)