Question 10
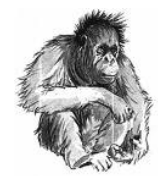
The animal below is endangered (rare). Which graph correctly describes its population change over time?
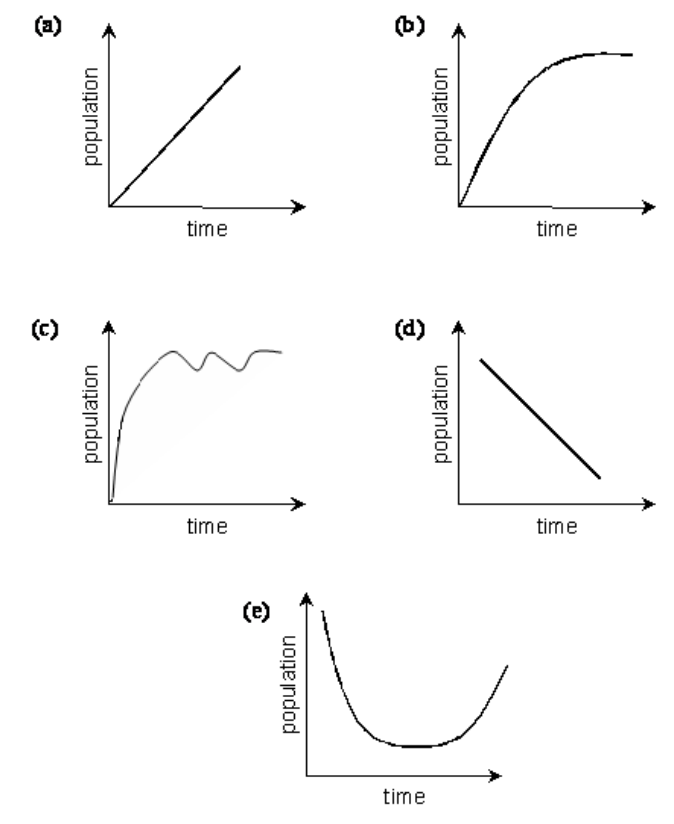
The horizontal axes show time; the vertical axes show population. Choices A–E are shown in the figure.
The horizontal axes show time; the vertical axes show population. Choices A–E are shown in the figure.