Question 1
Experiment I. Base your answers to questions 31 through 35 on the experiment described below.
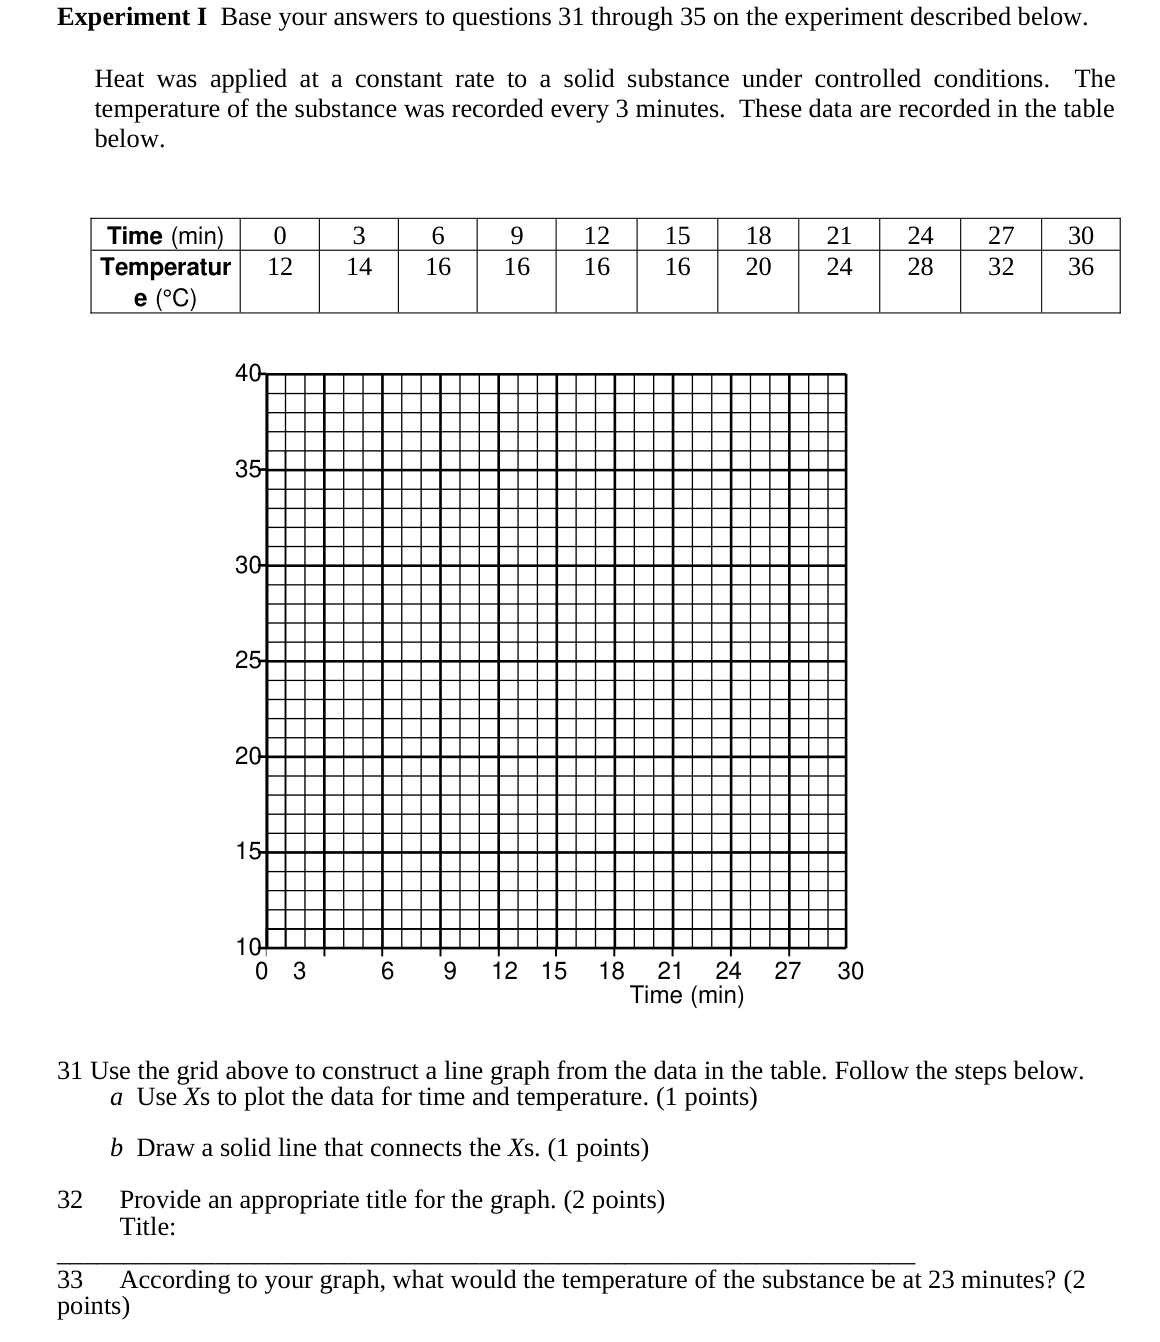
Heat was applied at a constant rate to a solid substance under controlled conditions. The temperature of the substance was recorded every 3 minutes. These data are recorded in the table below.
|Time (min)|0|3|6|9|12|15|18|21|24|27|30|
|---|---|---|---|---|---|---|---|---|---|---|---|
|Temperature (°C)|12|14|16|16|16|16|20|24|28|32|36|
31. Use the grid above to construct a line graph from the data in the table. Follow the steps below.
a. Use Xs to plot the data for time and temperature. (1 point)
b. Draw a solid line that connects the Xs. (1 point)
32. Provide an appropriate title for the graph. (2 points)
Title: ____________________
33. According to your graph, what would the temperature of the substance be at 23 minutes? (2 points)
34. What is the independent (manipulated) variable in this experiment? (2 points)
35. If heat was added at a constant rate to the solid substance, why did the temperature remain at 16°C for approximately 6 minutes? (2 points)
The original grid has time 0–30 minutes and temperature 10–40°C. The source splits the word “Temperature” across lines and prints “1 points”; these layout/grammar artifacts are normalized above. The stated “approximately 6 minutes” is retained; the table plateau actually spans minutes 6–15.
Original source panels:

Heat was applied at a constant rate to a solid substance under controlled conditions. The temperature of the substance was recorded every 3 minutes. These data are recorded in the table below.
|Time (min)|0|3|6|9|12|15|18|21|24|27|30|
|---|---|---|---|---|---|---|---|---|---|---|---|
|Temperature (°C)|12|14|16|16|16|16|20|24|28|32|36|
31. Use the grid above to construct a line graph from the data in the table. Follow the steps below.
a. Use Xs to plot the data for time and temperature. (1 point)
b. Draw a solid line that connects the Xs. (1 point)
32. Provide an appropriate title for the graph. (2 points)
Title: ____________________
33. According to your graph, what would the temperature of the substance be at 23 minutes? (2 points)
34. What is the independent (manipulated) variable in this experiment? (2 points)
35. If heat was added at a constant rate to the solid substance, why did the temperature remain at 16°C for approximately 6 minutes? (2 points)
The original grid has time 0–30 minutes and temperature 10–40°C. The source splits the word “Temperature” across lines and prints “1 points”; these layout/grammar artifacts are normalized above. The stated “approximately 6 minutes” is retained; the table plateau actually spans minutes 6–15.
Original source panels: