Question 3
ELECTRICAL RESISTANCES OF METAL WIRES
Every material is characterized by its electrical resistance. If a metal wire is connected to a
battery, electrical current will flow through the wire. By reading the voltage difference between
the ends of the wire and the current flowing through the wire, the resistance of the wire can be
calculated.
Objectives:
In this experiment you will determine the resistances of materials.
Materials:
Electrical circuit board
Four batteries 1.5 V
Procedure:
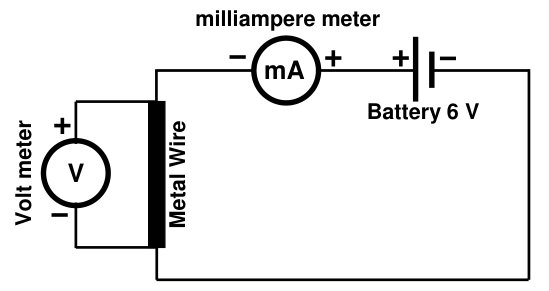
1\. Arrange the following electrical circuit using an electrical board and electrical
jumpers/connectors provided:
milliampere meter
mA
Battery 6 V
meter Wire V
Volt Metal
2\. The dependence of resistance on the length of a metal wire is investigated. Use a metal
wire with the cross-section area A1 of 0.1 mm2 and the length (L) of 5 cm. Read the
electrical current (I) flowing through the wire and the voltage (V) across the wire, which
are displayed by a milliampere meter and a volt meter, respectively.
3\. Repeat the measurement for the length (L) of 10 cm, 15 cm, and 20 cm.
4\. Calculate resistance (R) of the wire using the relation R=V/I.
5\. Make a table for the measurement and calculated resistance.
6\. Make a graph describing resistance (R) as a function of wire’s length (L) from the table.
7\. Now, resistance as a function of wire’s cross-section area is investigated. Use a metal
wire with the length of 20 cm and the area A1 of 0.1 mm2. Read the electrical current (I)
flowing through the wire and the voltage (V) across the wire.
8\. Repeat the measurement for the area A2, A3, and A4.
9\. Calculate resistance (R) of the wire using the relation R=V/I.
10\. Make a table for the measurement and calculated resistance.
11\. Make a graph describing the dependence of resistance (R) on 1/A from the table.
Question:
What are your conclusions from the two graphs.
Every material is characterized by its electrical resistance. If a metal wire is connected to a
battery, electrical current will flow through the wire. By reading the voltage difference between
the ends of the wire and the current flowing through the wire, the resistance of the wire can be
calculated.
Objectives:
In this experiment you will determine the resistances of materials.
Materials:
Electrical circuit board
Four batteries 1.5 V
Procedure:
1\. Arrange the following electrical circuit using an electrical board and electrical
jumpers/connectors provided:
milliampere meter
mA
Battery 6 V
meter Wire V
Volt Metal
2\. The dependence of resistance on the length of a metal wire is investigated. Use a metal
wire with the cross-section area A1 of 0.1 mm2 and the length (L) of 5 cm. Read the
electrical current (I) flowing through the wire and the voltage (V) across the wire, which
are displayed by a milliampere meter and a volt meter, respectively.
3\. Repeat the measurement for the length (L) of 10 cm, 15 cm, and 20 cm.
4\. Calculate resistance (R) of the wire using the relation R=V/I.
5\. Make a table for the measurement and calculated resistance.
6\. Make a graph describing resistance (R) as a function of wire’s length (L) from the table.
7\. Now, resistance as a function of wire’s cross-section area is investigated. Use a metal
wire with the length of 20 cm and the area A1 of 0.1 mm2. Read the electrical current (I)
flowing through the wire and the voltage (V) across the wire.
8\. Repeat the measurement for the area A2, A3, and A4.
9\. Calculate resistance (R) of the wire using the relation R=V/I.
10\. Make a table for the measurement and calculated resistance.
11\. Make a graph describing the dependence of resistance (R) on 1/A from the table.
Question:
What are your conclusions from the two graphs.