Question 8
The graph gives the goals scored by Ranjit’s soccer team in its first thirteen matches. After match fourteen, the median has increased but the mode is unchanged. Which best describes the number of goals in the last match?
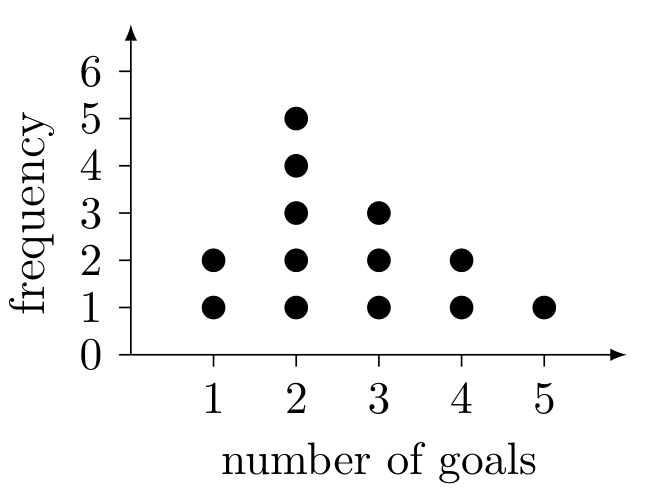
The horizontal axis is number of goals and the vertical axis is frequency.
The horizontal axis is number of goals and the vertical axis is frequency.