Question 9
The 6 by 6 table in the diagram below is divided into 17 regions, each containing a number. Each of the 36 squares contains one of the numbers 1, 2, 3, 4, 5 and 6. All six numbers appear in every row and every column. The number in a white region is the number in the only square of the region. The number in a yellow region is the difference when the number in one of the squares is subtracted from the number in the other square. The number in a green region is the quotient when the number in one of the squares is divided by the number in the other square. The number in a red region is the sum of the numbers in all the squares of the region. The number in a blue region is the product of the numbers in all the squares of the region. Fill in the 36 numbers.
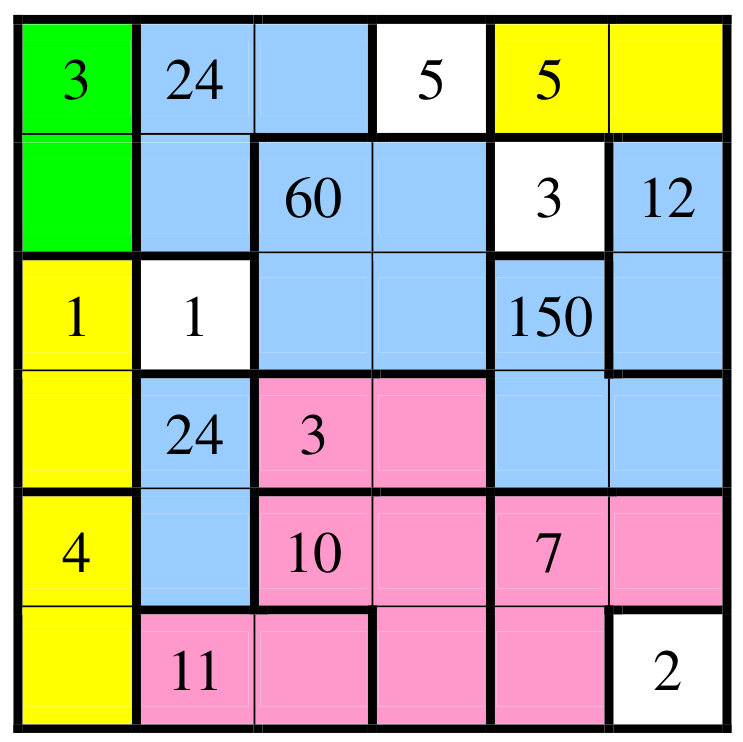
Original answer template:
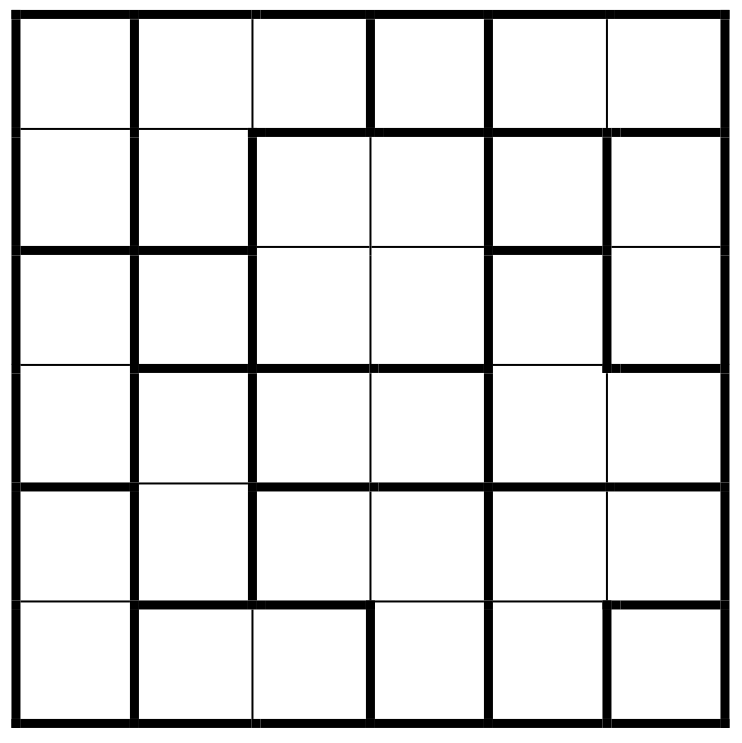
Submission guidance: Supply the completed grid only; the source does not require a written proof for this odd-numbered problem. It is represented as a manually graded grid response, with all-or-nothing credit.
Original answer template:
Submission guidance: Supply the completed grid only; the source does not require a written proof for this odd-numbered problem. It is represented as a manually graded grid response, with all-or-nothing credit.