Question 143
The price of beans - the table and graph, given below, show the evolution of the average price of three types of beans, $A$, $B$ e $C$, in the food exchange during the first four months of a certain year: of these 3 types, those that present, respectively, the highest and lowest percentage growth in the price in this period are:
- $A$ e $B$
- $A$ e $C$
- $B$ e $C$
- $C$ e $A$
- $C$ e $B$
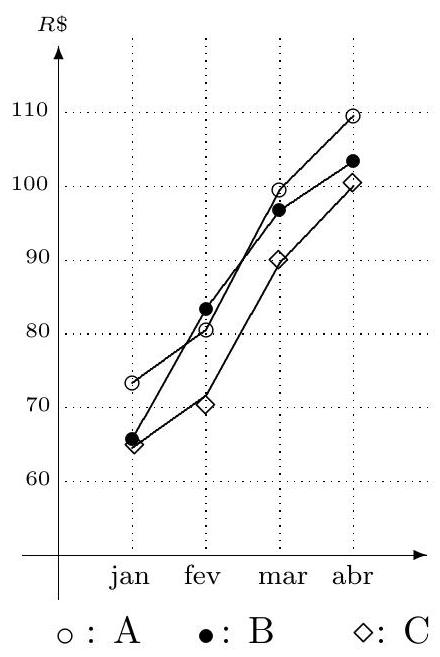
| | jan | feb | sea | apr |
| :-: | :-----: | :-----: | :-----: | :------: |
| A | 65,67 | 83,33 | 96,67 | 103,33 |
| B | 73,30 | 80,50 | 99,55 | 109,50 |
| C | 64,50 | 71,57 | 89,55 | 100,00 |