Skip to content / Đến nội dung
ThichHocToan.com

SASMO 2016 Secondary 2 (Grade 8) Contest

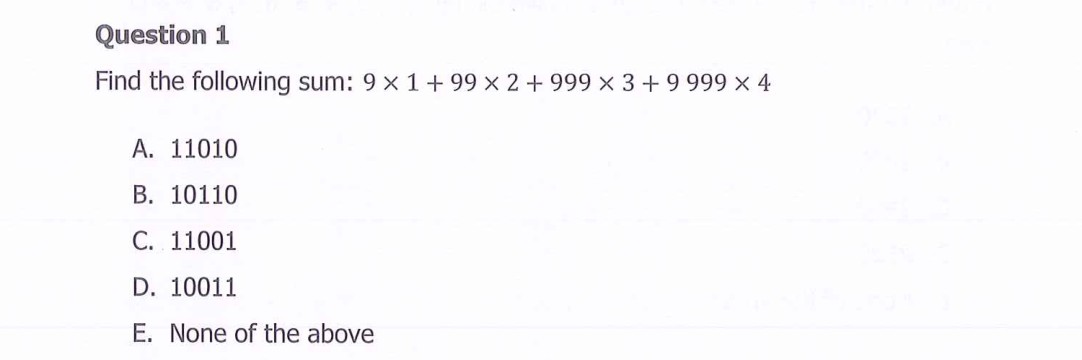
Question 1

Find the following sum: 9 x 1+99x2+999x3+49999x4
A, 11010

Question illustration
  1. 11010
  2. 10110
  3. 11001
  4. 10011
  5. None of the above

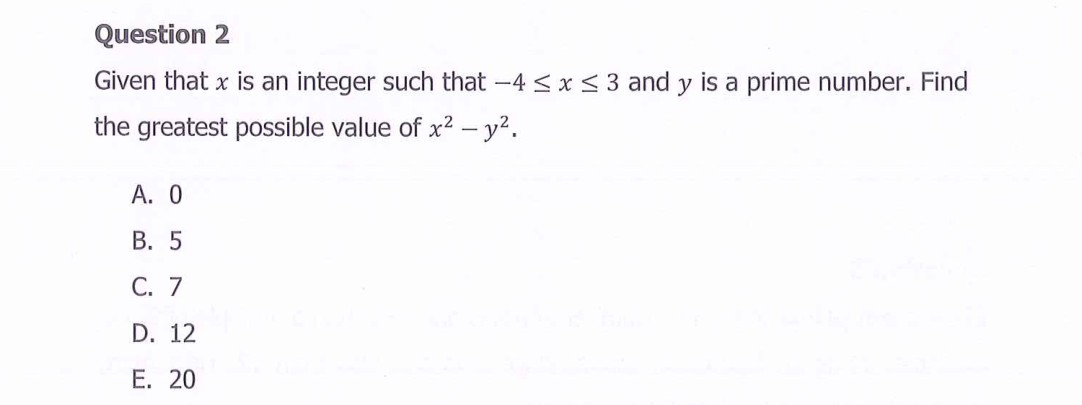
Question 2

Given that x is an integer such that —4 ‹ x ‹ 3 and y is a prime number. Find
the greatest possible value of x? — y?.

Question illustration
  1. 0
  2. 5 G7
  3. See the source image for option C.
  4. . 12
  5. 20

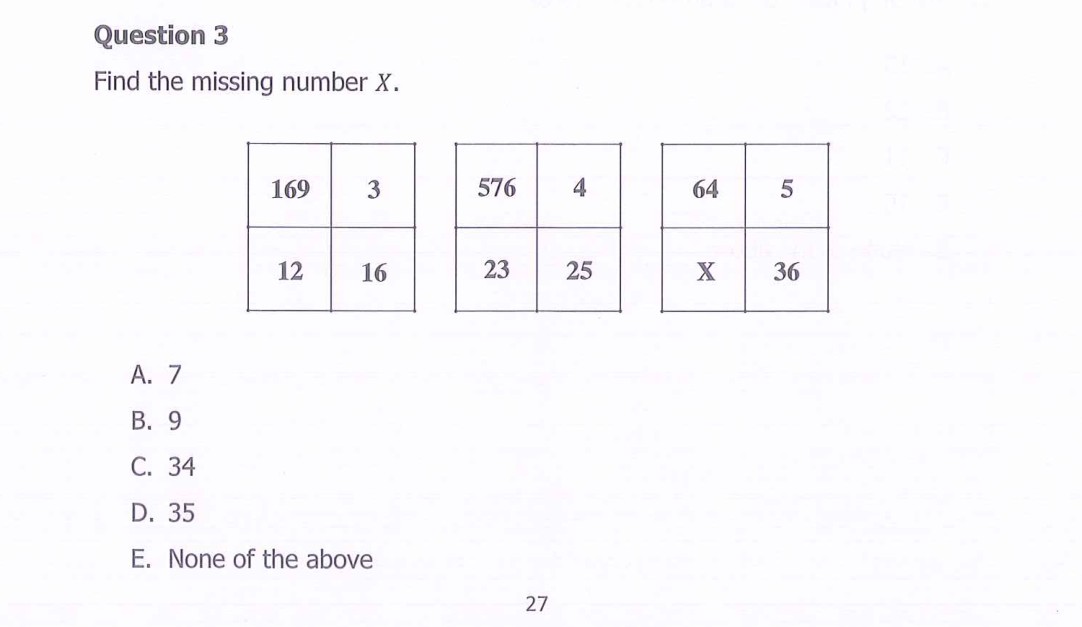
Question 3

: Find the missing number X.
x

Question illustration
  1. 7
  2. 9
  3. 34
  4. 35
  5. None of the above

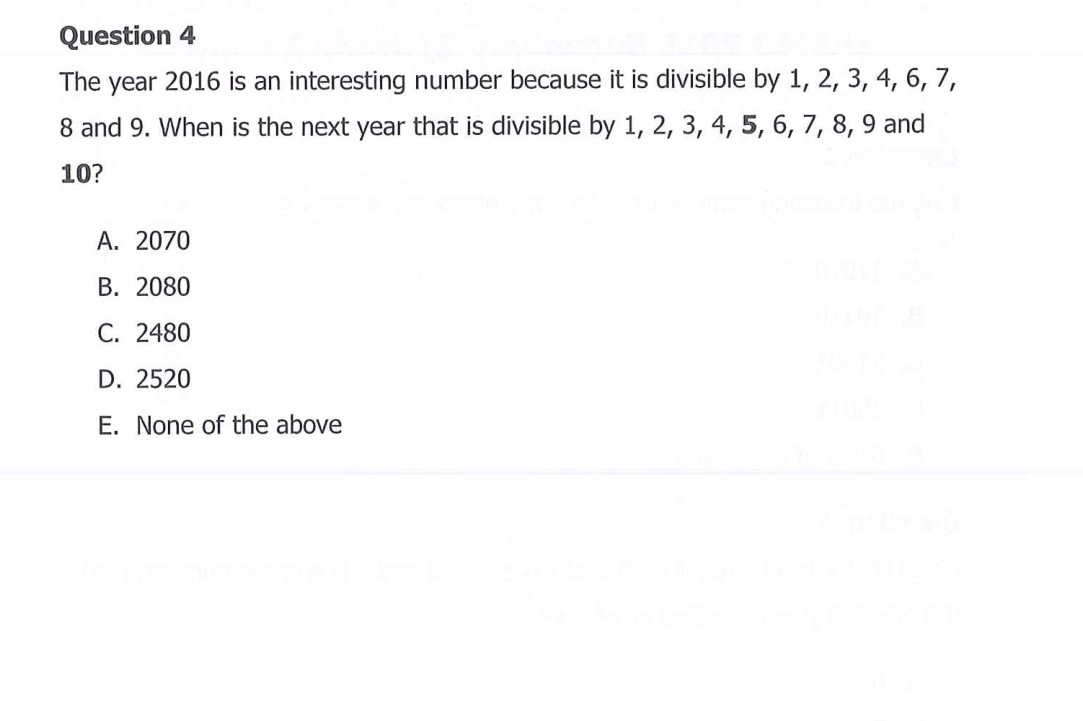
Question 4

The year 2016 is an interesting number because it is divisible by 1, 2, 3, 4, 6, 7,
8 and 9. When is the next year that is divisible by 1, 2, 3, 4, 5, 6, 7, 8, 9 and
10?

Question illustration
  1. 2070
  2. 2080
  3. 2480
  4. 2520
  5. None of the above

Question 5

.
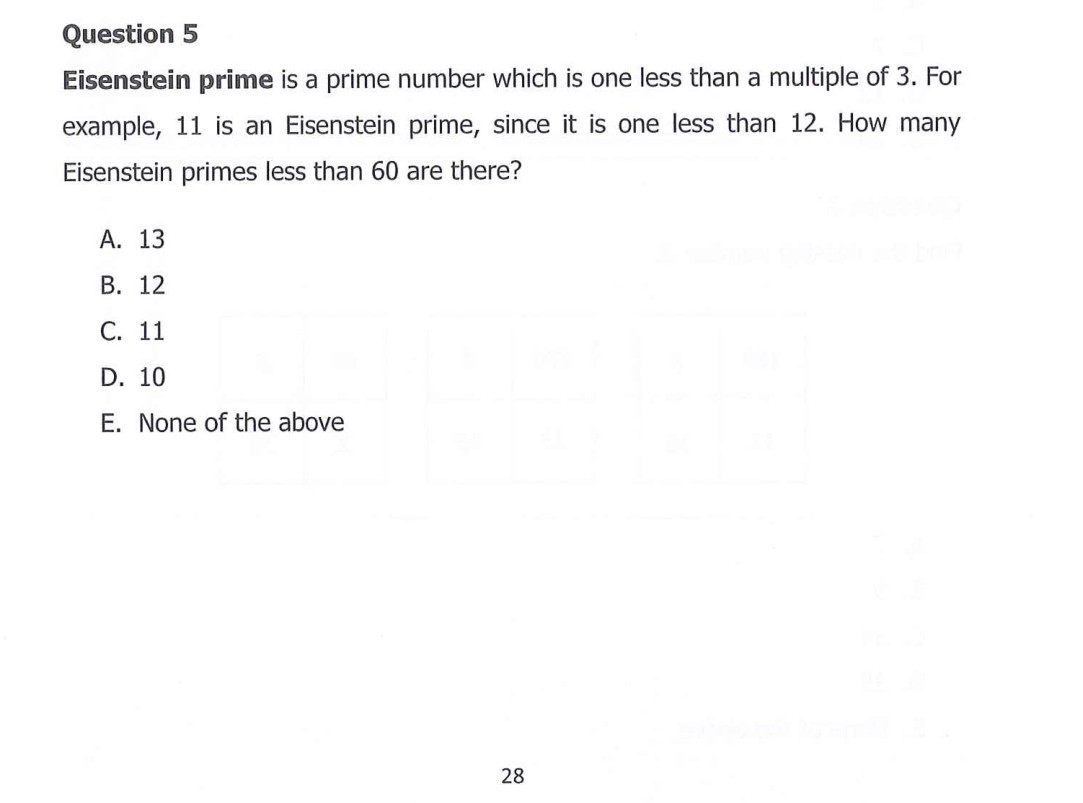
Eisenstein prime is a prime number which is one less than a multiple of 3. For
example, 11 is an Eisenstein prime, since it is one less than 12. How many
Eisenstein primes less than 60 are there?

Question illustration
  1. 13
  2. 12
  3. . 11
  4. 10
  5. None of the above

Question 6

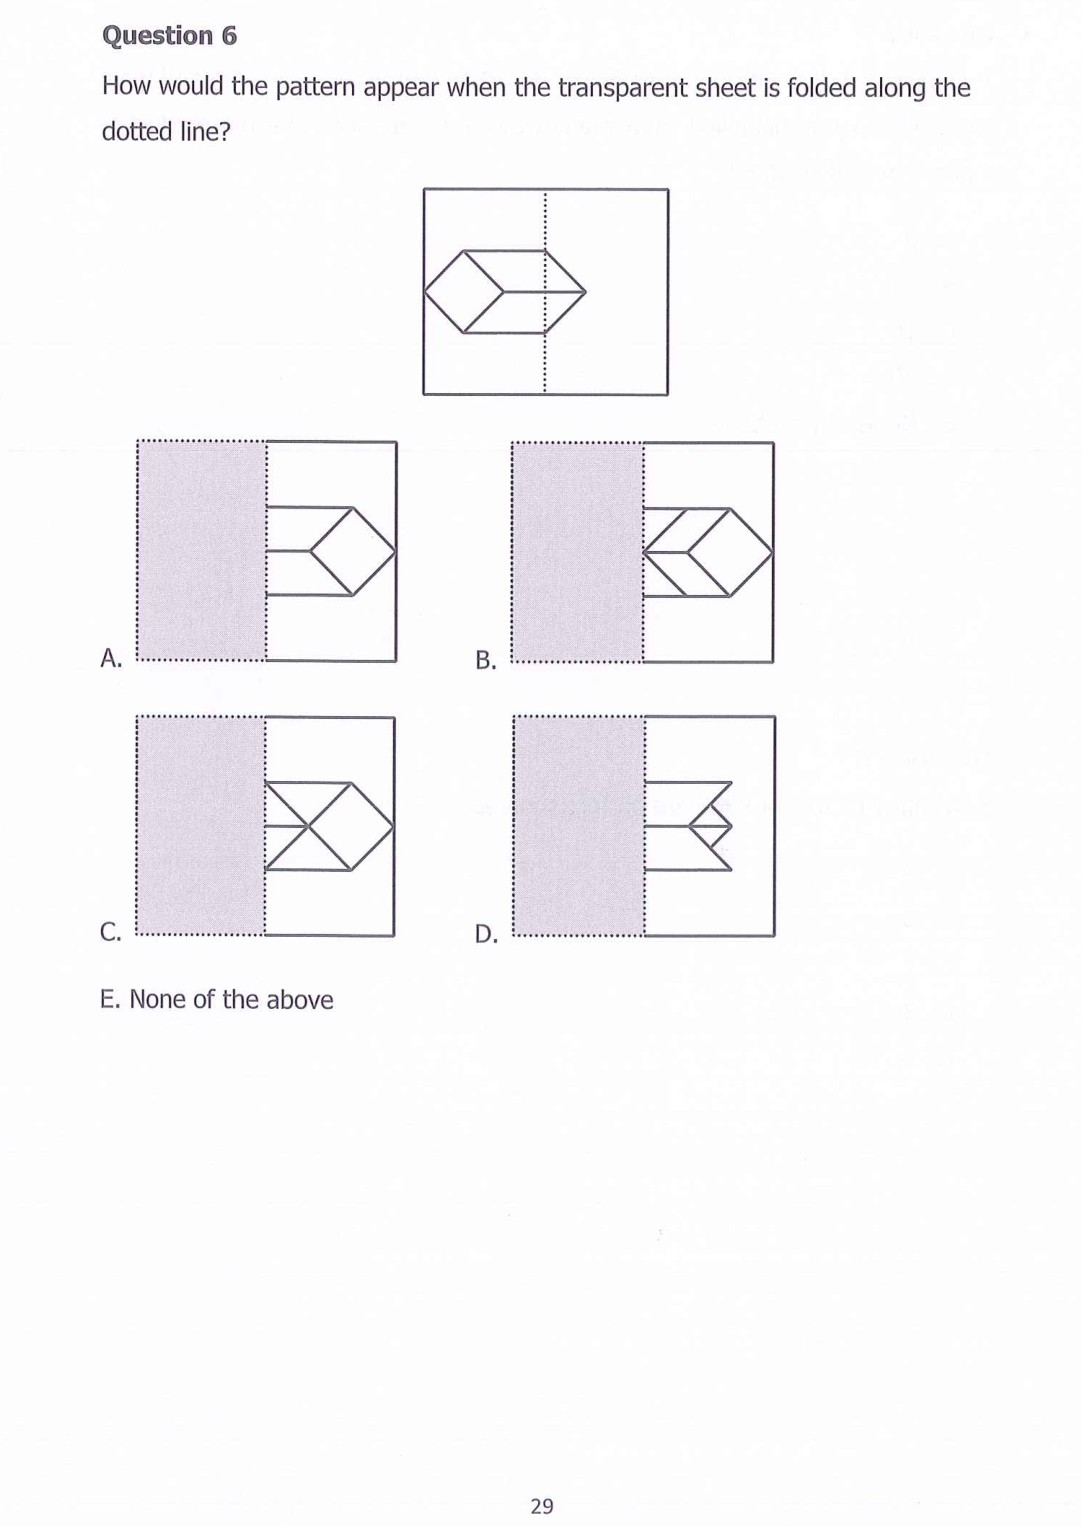
How would the pattern appear when the transparent sheet is folded along the
dotted line?
i i i
/
i i i i
i ; i ;
1 i H 1 H
E. None of the above
i
\
ba
a

Question illustration
  1. § B. vs
  2. See the source image for option B.
  3. sg D. mE
  4. See the source image for option D.
  5. None of the above

Question 7

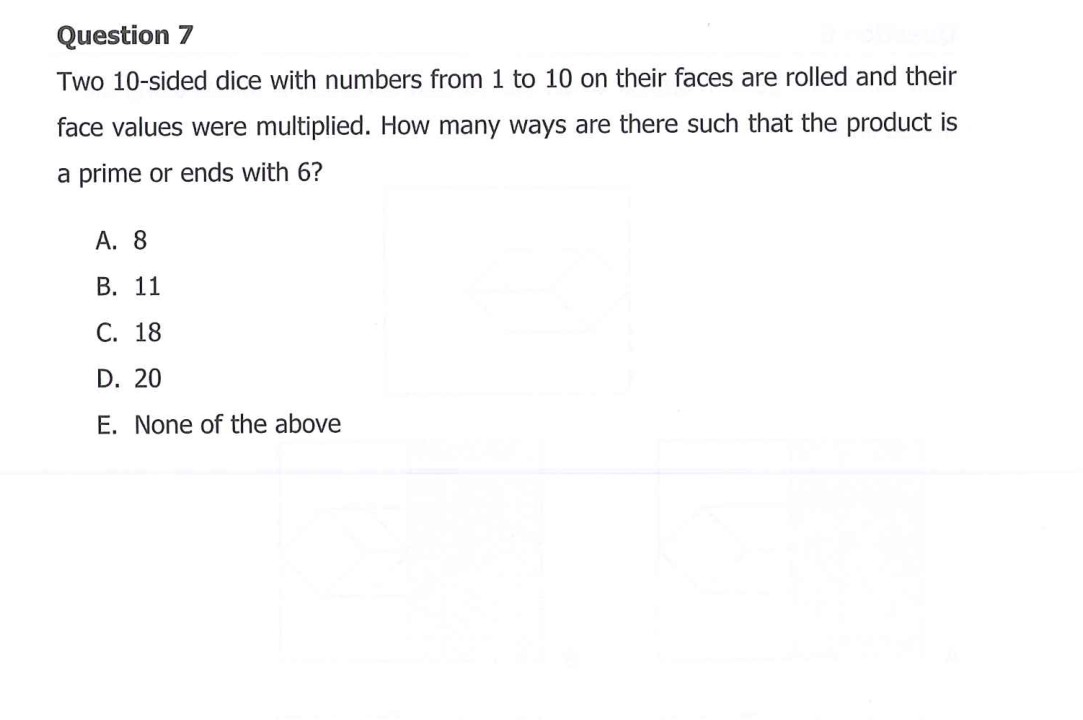
Two 10-sided dice with numbers from 1 to 10 on their faces are rolled and their
face values were multiplied. How many ways are there such that the product is
a prime or ends with 6?

Question illustration
  1. 8
  2. 11
  3. 18
  4. 20
  5. None of the above

Question 8

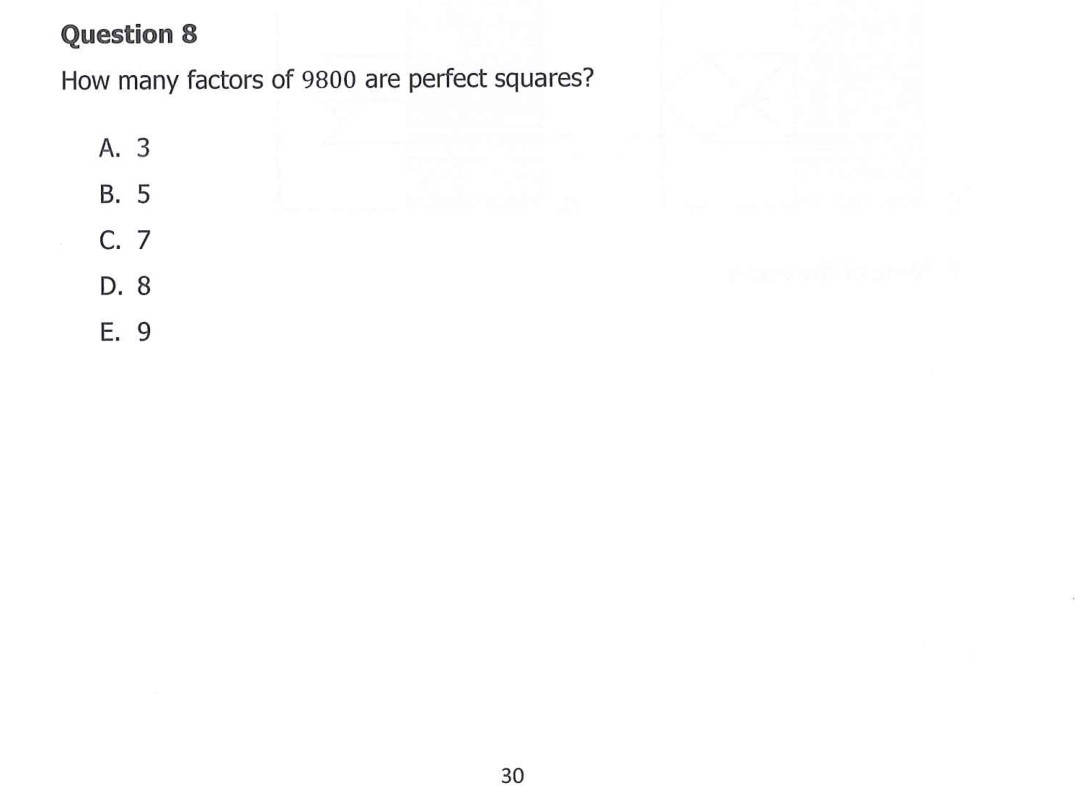
How many factors of 9800 are perfect squares?

A. 3

BS

G7

dD. 8

BE. 9
Sea eees a Saeed pees Se ig
i

Lok = =
ay

1 Sf — =
if {
}
:
: a 1 1
EES

Question illustration
  1. 3
  2. 5 €. 7
  3. 7
  4. See the source image for option D.
  5. See the source image for option E.

Question 9

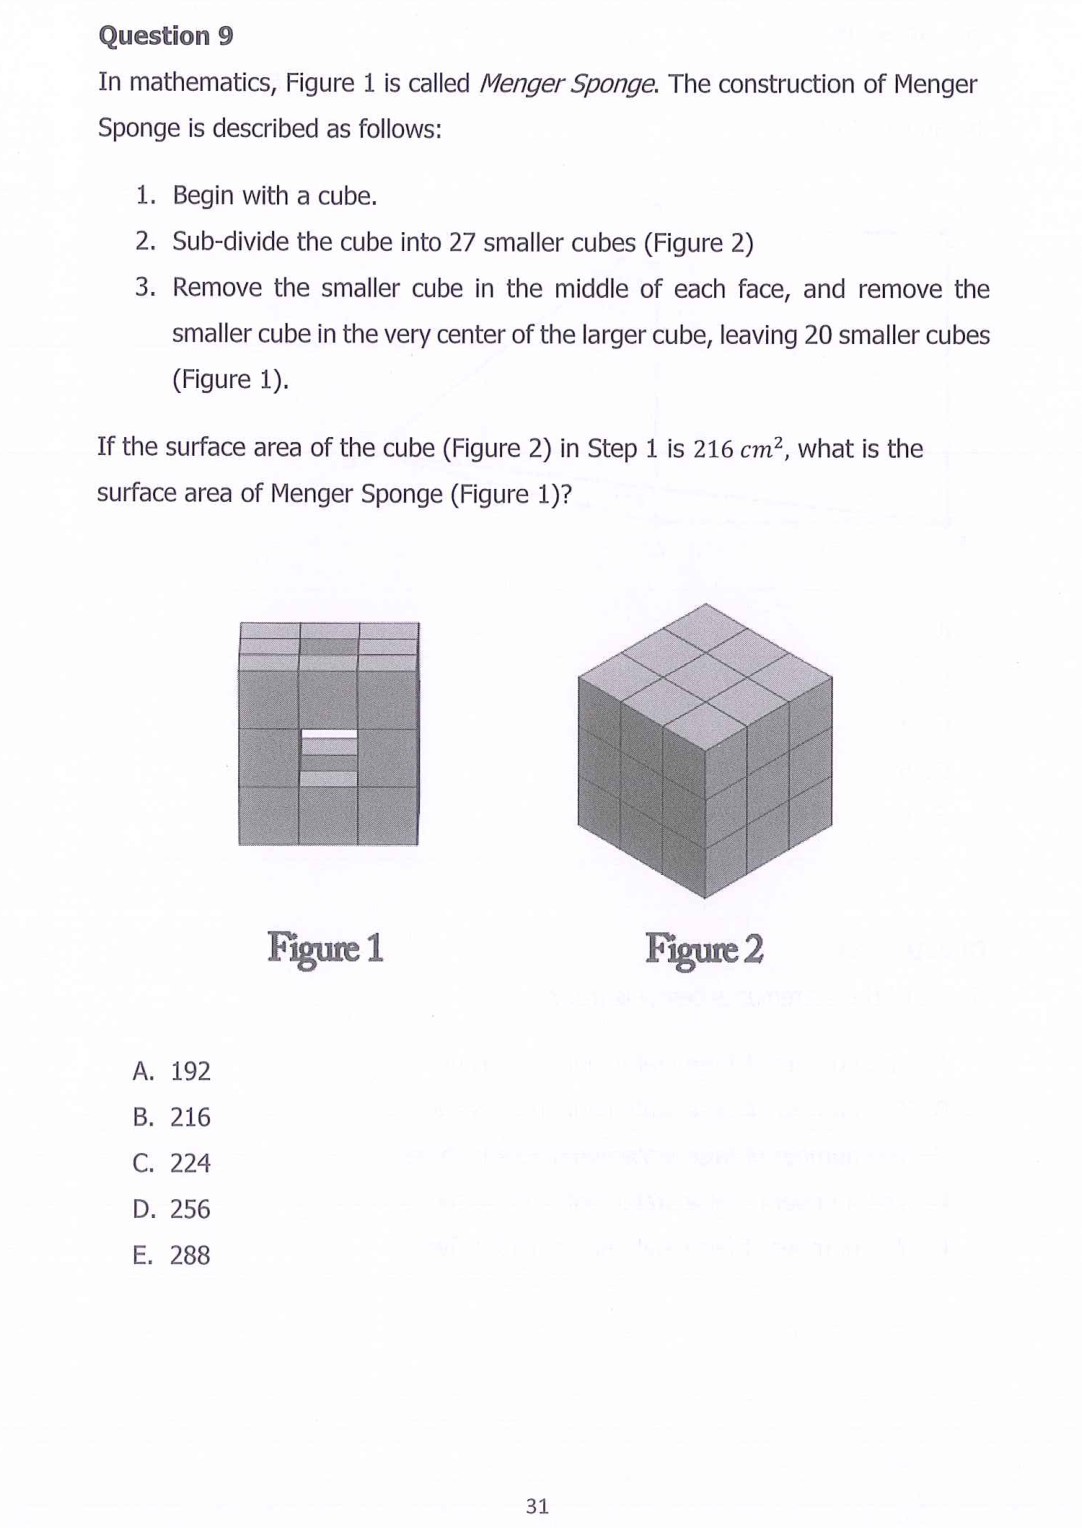
In mathematics, Figure 1 is called Menger Sponge. The construction of Menger
Sponge is described as follows:
1. Begin with a cube.
2. Sub-divide the cube into 27 smaller cubes (Figure 2)
3. Remove the smaller cube in the middle of each face, and remove the
smaller cube in the very center of the larger cube, leaving 20 smaller cubes
(Figure 1).
If the surface area of the cube (Figure 2) in Step 1 is 216 cm?, what is the
=) surface area of Menger Sponge (Figure 1)?

Eee S| Lo
Figure 1 Figure 2
Question illustration
  1. 192
  2. 216
  3. 224
  4. 256
  5. 288

Question 10

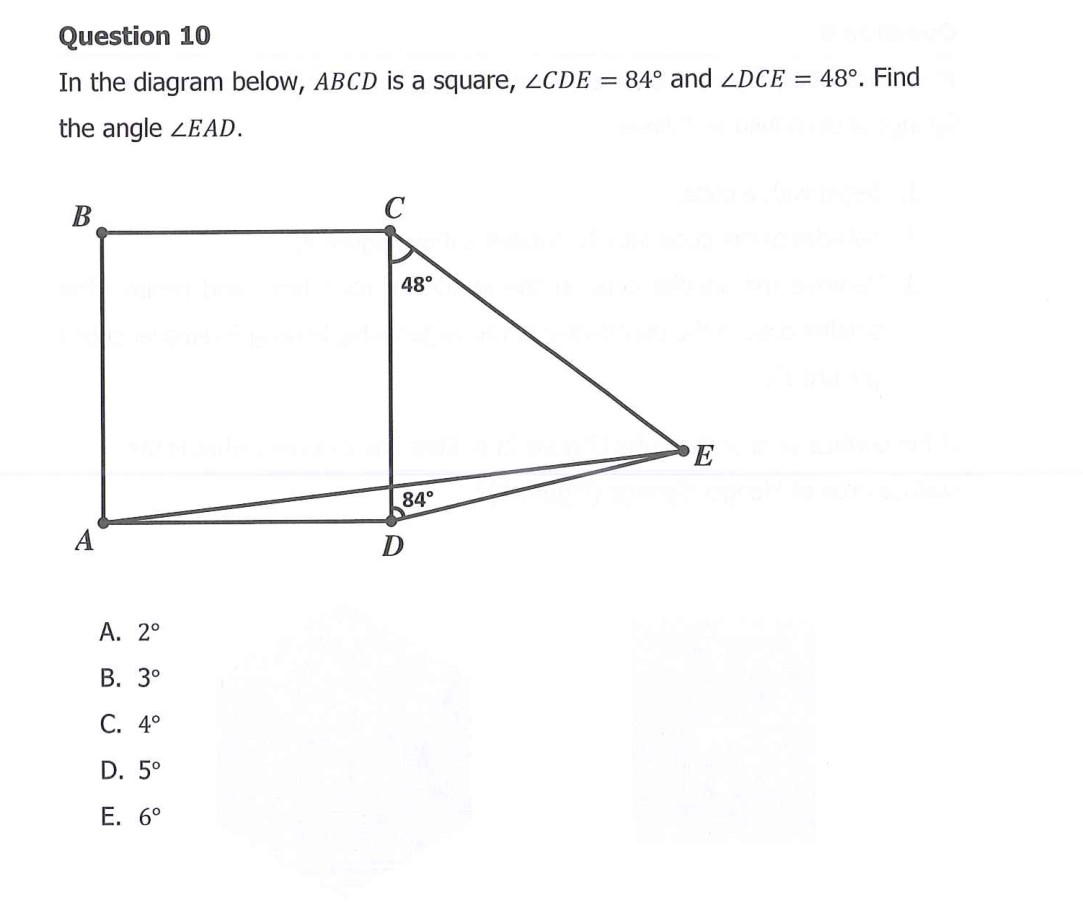
In the diagram below, ABCD is a square, ZCDE = 84° and 2DCE = 48°. Find
the angle 2EAD.
B c
›
48°
E
A D
A, 2°
B, 3°
Cc. 4°
1D
Bib”

Question illustration
  1. 2°
  2. 3?
  3. 4°
  4. . 5?
  5. 6°

Question 11

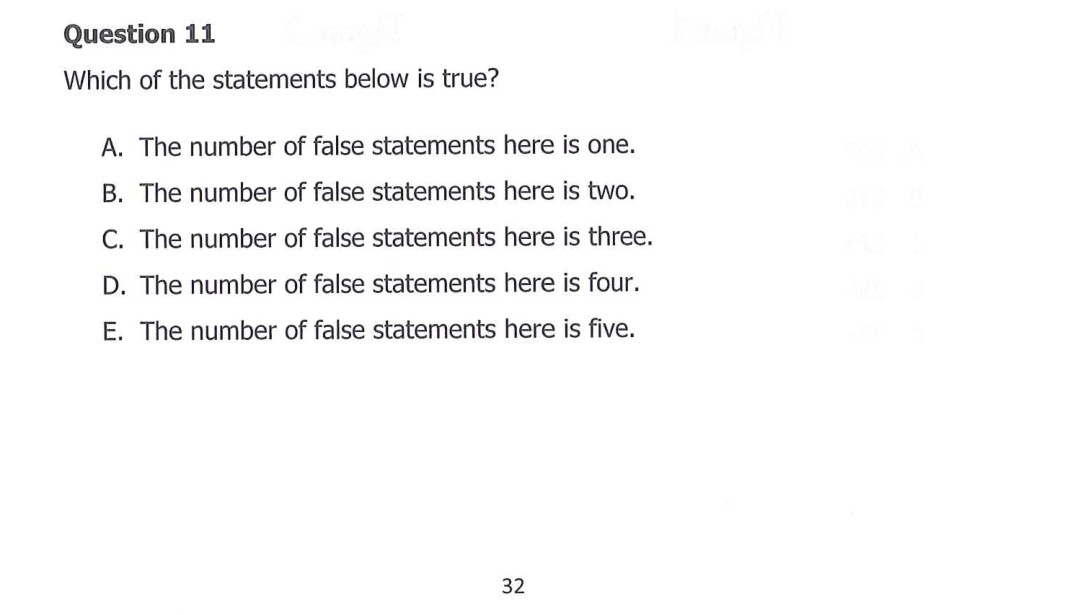
Which of the statements below is true?

Question illustration
  1. The number of false statements here is one.
  2. The number of false statements here is two.
  3. The number of false statements here is three.
  4. The number of false statements here is four.
  5. The number of false statements here is five.

Question 12

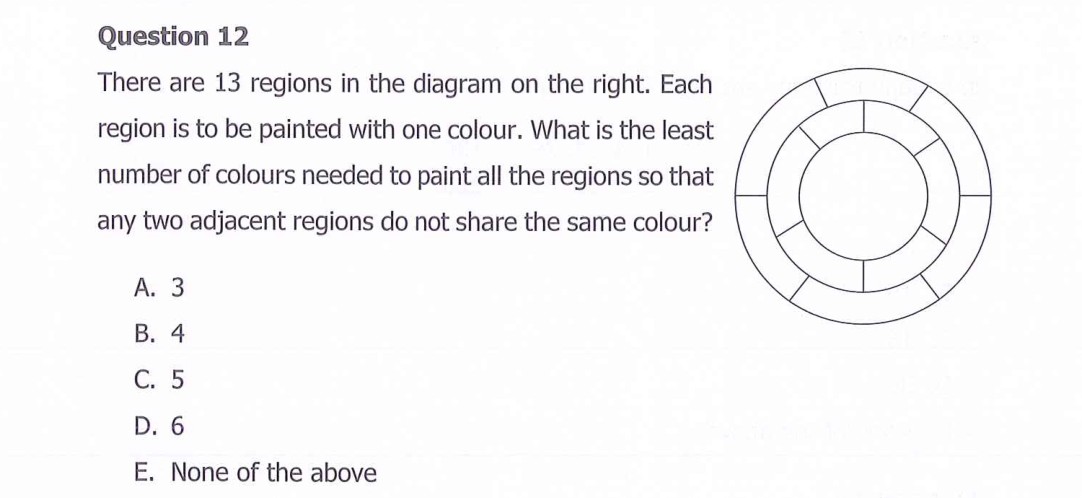
There are 13 regions in the diagram on the right. Each
region is to be painted with one colour. What is the least
number of colours needed to paint all the regions so that
any two adjacent regions do not share the same colour?
Ay 3
B.4
C5
k D. 6
/ E. None of the above

Question illustration
  1. 3
  2. 4
  3. 5
  4. 6
  5. None of the above

Question 13

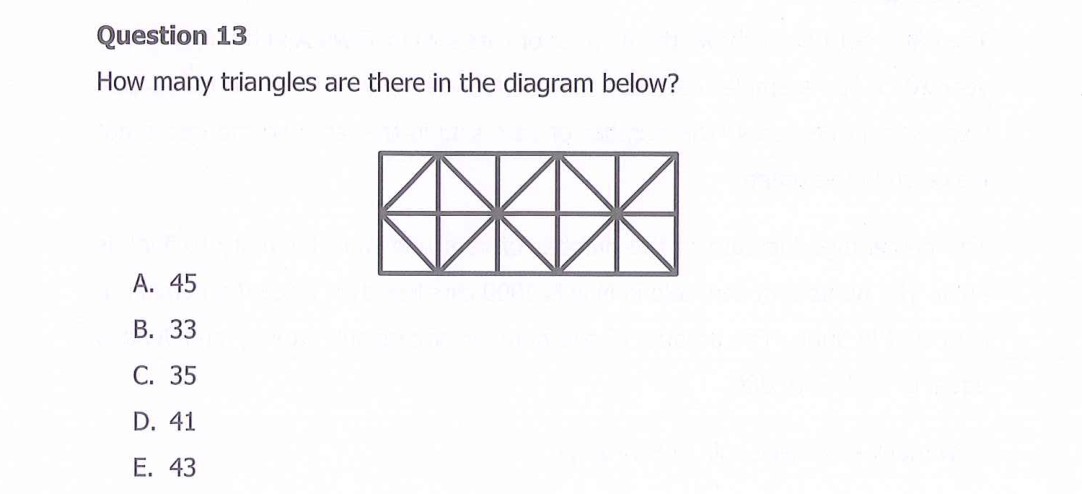
ES How many triangles are there in the diagram below?

Question illustration
  1. 45
  2. 33 ., 85
  3. ,.35
  4. 41 BE. 43
  5. See the source image for option E.

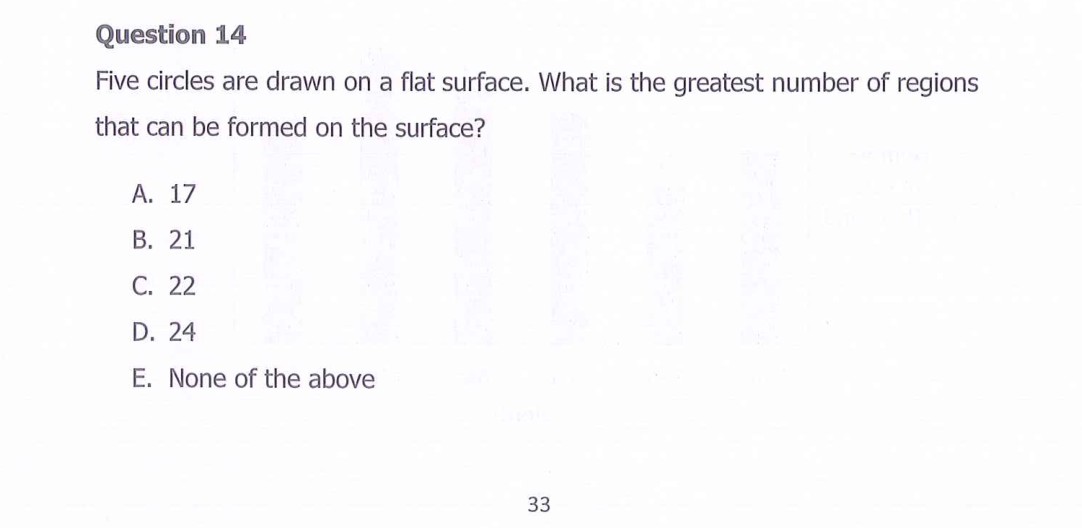
Question 14

Five circles are drawn on a flat surface. What is the greatest number of regions
that can be formed on the surface?

Question illustration
  1. 17
  2. 21 Ey 22)
  3. 22
  4. 24
  5. None of the above

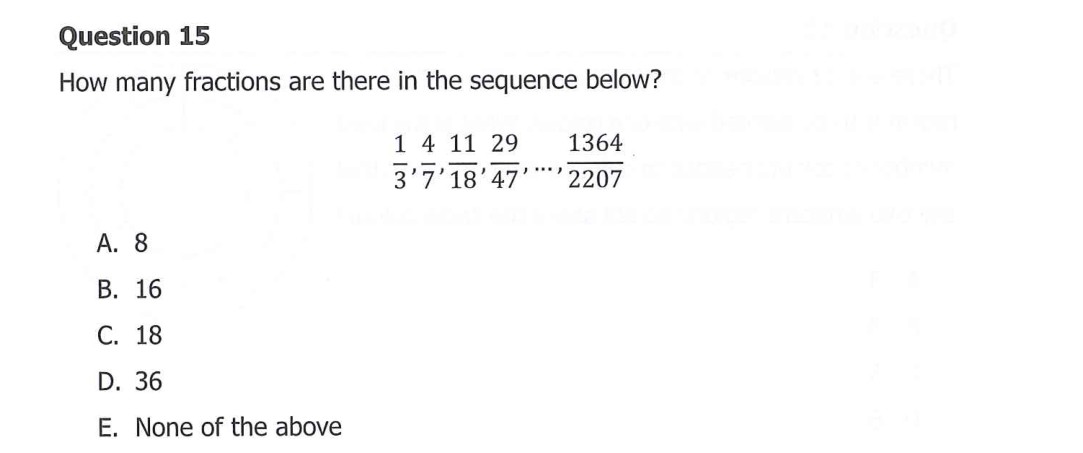
Question 15

How many fractions are there in the sequence below?
14 11 29 1364
3'7'18'47'’ 2207

A 8

Question illustration
  1. 8
  2. 16
  3. 18
  4. 36
  5. None of the above

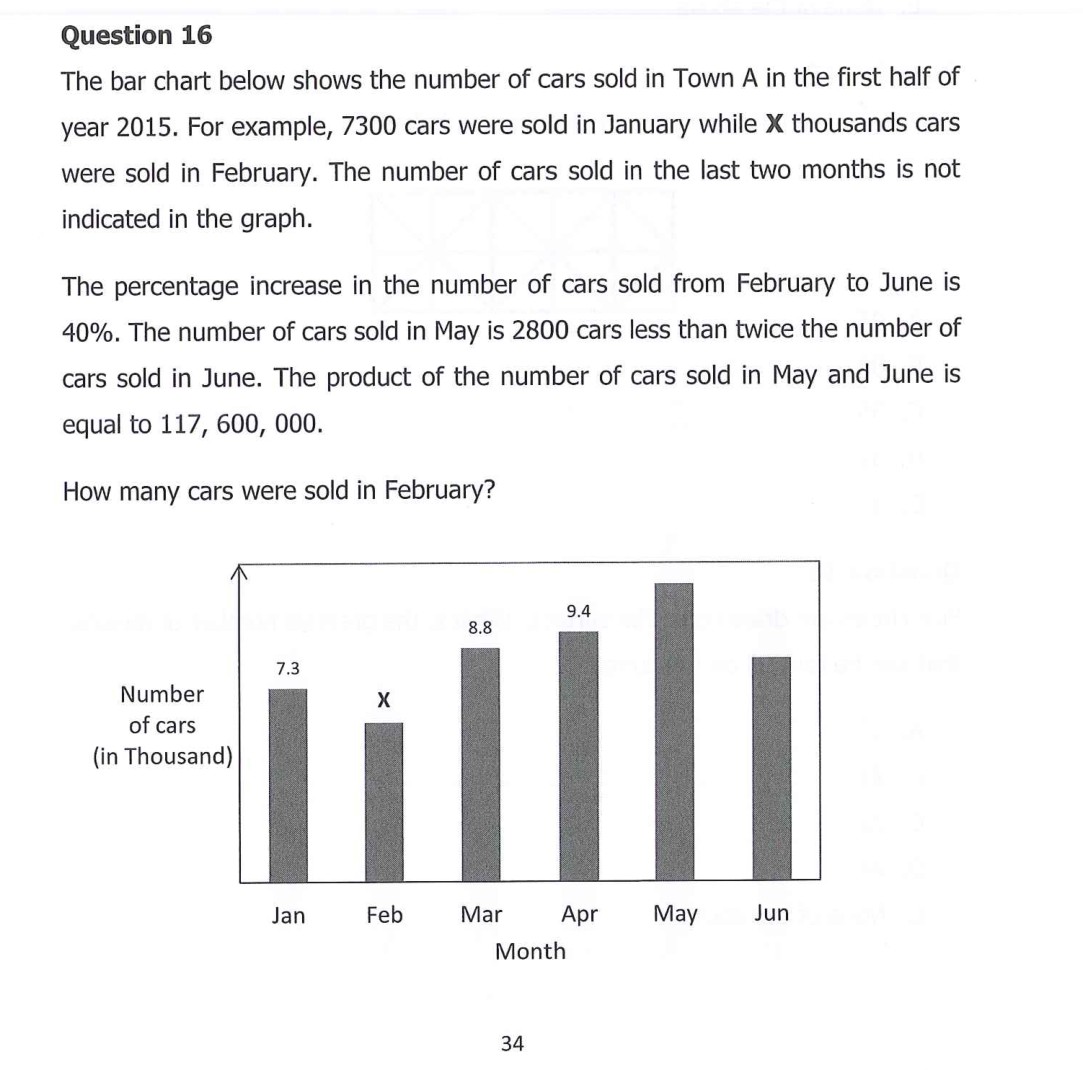
Question 16

The bar chart below shows the number of cars sold in Town A in the first half of
year 2015. For example, 7300 cars were sold in January while X thousands cars
were sold in February. The number of cars sold in the last two months is not
indicated in the graph.
The percentage increase in the number of cars sold from February to June is
40%. The number of cars sold in May is 2800 cars less than twice the number of
cars sold in June. The product of the number of cars sold in May and June is
equal to 117, 600, 000.
How many cars were sold in February?

Number x
of cars
(in Thousand)
Jan Feb Mar Apr May Jun
Month
eee
=
&

SS ee ey

Question illustration

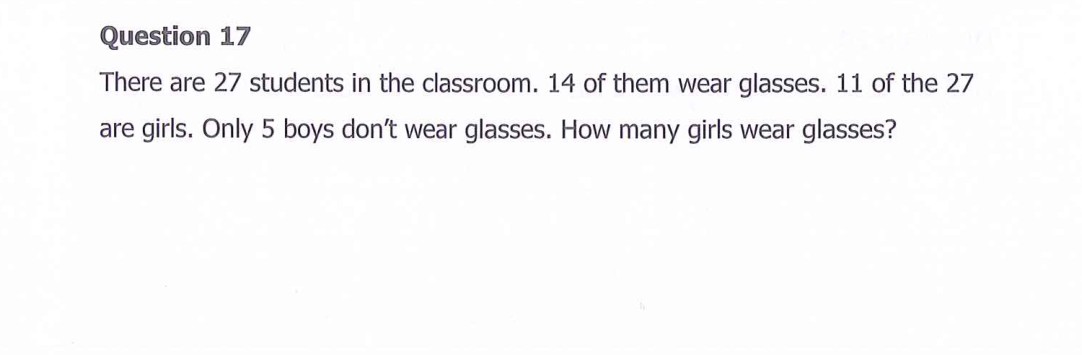
Question 17

There are 27 students in the classroom. 14 of them wear glasses. 11 of the 27
are girls. Only 5 boys don’t wear glasses. How many girls wear glasses?

Question illustration

Question 18

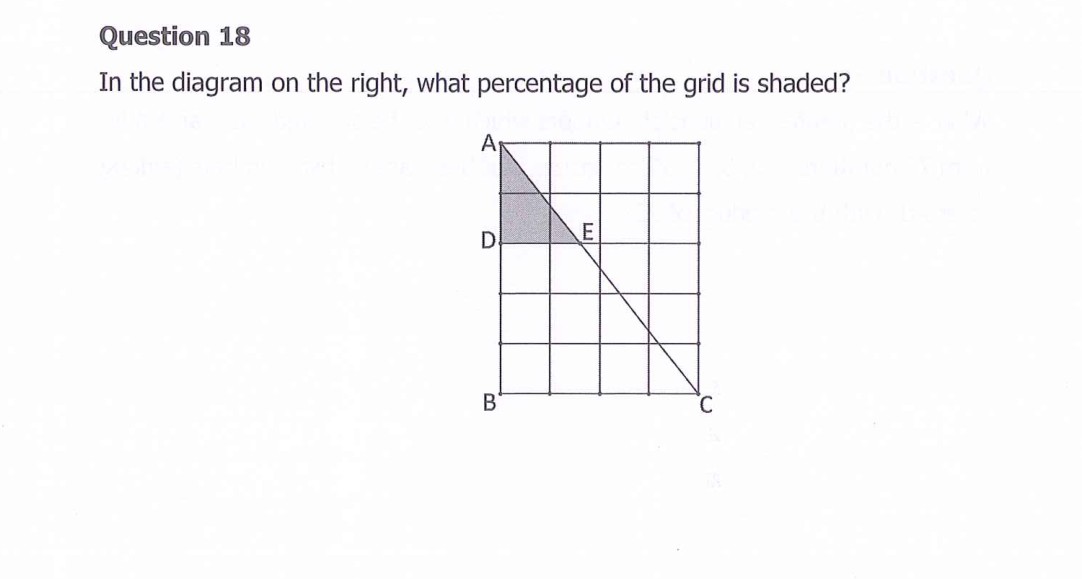
In the diagram on the right, what percentage of the grid is shaded?

A

Naan
Vem
L| KT I

B (a4

Question illustration

Question 19

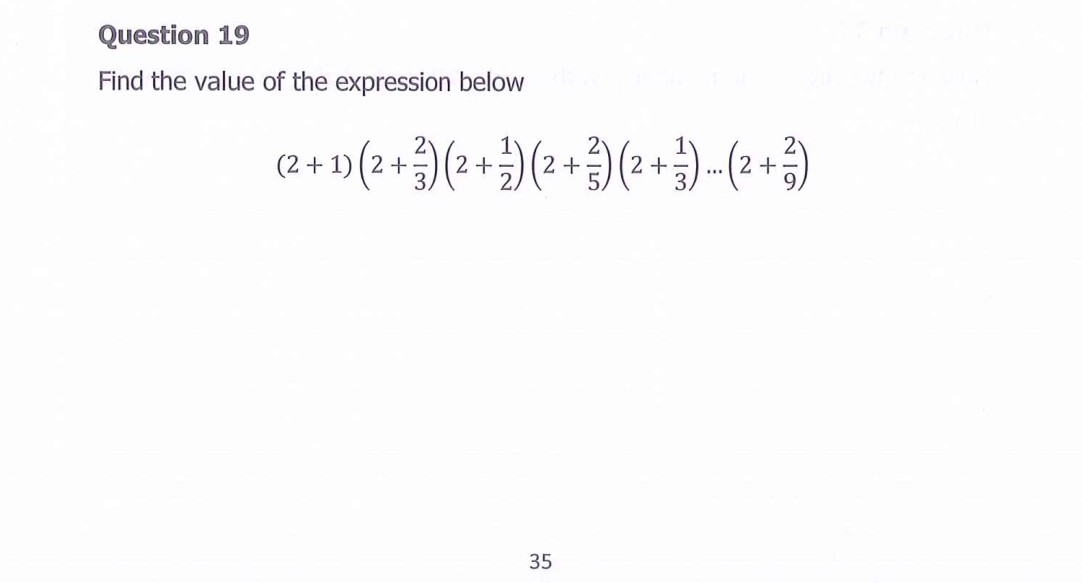
Find the value of the expression below

2 1 2 1 2
+0)(245)(2+3)(2+3)(@+3)~(2+5)
ee ee eS SSS ee

Question illustration

Question 20

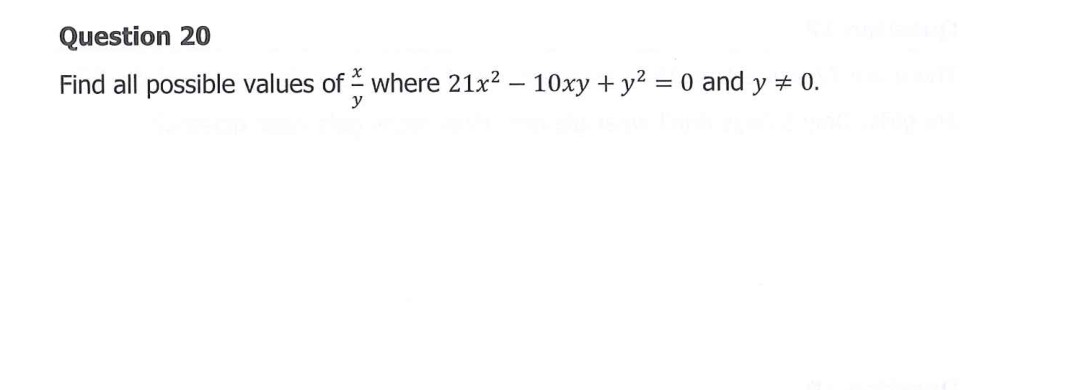
Find all possible values of = where 21x? — 10xy + y? =0 and y #0.

Question illustration