Skip to content / Đến nội dung
ThichHocToan.com

IMSO 2004 Science International - Experiment 2

Question 1

RESPIRATION


Objectives:

In this experiment you will determine the respiration rates of sprout


Materials:

1\. long sprout

2\. scalled plastic straw

3\. plasticin

4\. reaction tubes

5\. Tissue/filter paper

6\. short sprout

7\. timer

8\. KOH

9\. dye solution

Procedures:


1\. Prepared 2 tubes and give label to the tubes (A and B)


2\. Put 14 long sprout in tube A and 18 short spout in tube B


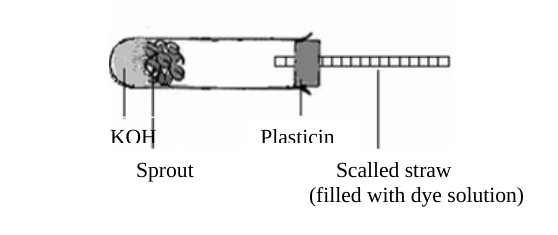
3\. Covered the tube with plasticin and straw (Arranged the equipment as seen in the

picture above).


KOH Plasticin
Sprout Scalled straw
(filled with dye solution)


4\. Observe how far dye solution move in every two minutes for 5 times.


5\. Put your result on the table


6\. Assume that 1 scale is 1 ml of oxygen consumed, calculate the respiration rates of

long sprout and short sprout in each minutes.

Table 1. Respiration rates in two different sprouts

| Time (per 2 mins) | Volume O₂ (ml): Sprout A | Volume O₂ (ml): Sprout B |
| --- | --- | --- |
| I | | |
| II | | |
| III | | |
| IV | | |
| V | | |
| Respiration rates | … ml/min | … ml/min |

Answer the following Questions:


1\. Which sprout has a higher respiration rates?


2\. Explain why the respiration of sprout A and sprout B is different?


3\. Change the table of your data into the graph. Respiration rates on the horizontal axis and

time in the vertical axis.


4\. Write down the conclusion of the experiment
Question illustration

Question 2

FRICTION FORCE


Friction force between two contacting surfaces plays important role in our daily life. The surfaces

of vehicle tires and the surface of roads must not be smooth to generate appreciable friction

forces between them. This friction force avoids a slippery motion of the vehicles, which may

cause the occurrence of unexpected accidents. On the other hand, lubricant oils are used to

reduce the friction forces between the moving parts in machines to avoid the occurrence of any

damage on the machine as well as to enhance the efficiency of energy usage. The friction force

between two surfaces depends on the contacting forces between these surfaces (how strong one

surface pulls another surface) and the nature of the contacting surfaces. Mathematically, the

friction force between two contacting surfaces just before a relative motion between two surfaces

occurs can be expressed as


Fs = C N


where

Fs : the friction force

N : the contacting force between two surface

C : a factor which describes the nature of the contacting surfaces. This factor is known as

the coefficient of friction.


Objectives:

In this experiment, you will measure the friction force between two contacting bodies using two

methods: i.e., (a) using a spring balance and without spring balance (b). You must compare the

results obtained by these two methods.


Materials:


1\. Wood plate


2\. Three blocks (200 g, 300 g, and 400 g) having different surface roughness:

(a) covered with a coarse sand paper,

(b) covered with a fine sand paper,

(c) covered with a mica


3\. Spring balance


4\. Ruler


Questions:

Determine the coefficient of frictions between each block and plane surface using a spring

balance. You must report the method (procedure) of measurement.


A.1. Surface covered with coarse sand paper

| Block mass (kg) | Contacting force or weight (N) | Friction force just before surface slippery (N) | Coefficient of friction |
| --- | --- | --- | --- |
| 0.2 | | | |
| 0.3 | | | |
| 0.4 | | | |

A.2. Surface covered with fine sand paper

| Block mass (kg) | Contacting force or weight (N) | Friction force just before surface slippery (N) | Coefficient of friction |
| --- | --- | --- | --- |
| | | | |
| | | | |
| | | | |

A.2. Surface covered with mica

| Block mass (kg) | Contacting force or weight (N) | Friction force just before surface slippery (N) | Coefficient of friction |
| --- | --- | --- | --- |
| | | | |
| | | | |
| | | | |

The source repeats label A.2. Blank entries remain blank.

Question 3

THE MAGIC OF ELECTRICITY


Energy can change its form from one to another. For instance, light energy of the Sun is changed

to chemical energy by plants through photosyntesis process.


Objectives:

In this experiment you will observe the change of electricity into heat energy.


Materials:

- plastics cup (50 ml) with cover

- water

- cables and connectors

- coil

- batteries with holder

- thermometer

- timer


Procedures:


1\. Fill the plastics cup with 50 ml of water


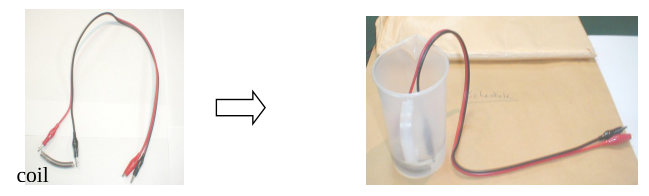
2\. Connect the coil with connector then put it into the plastics cup. Make sure that whole coil is

immersed in water. (See figure below)

coil


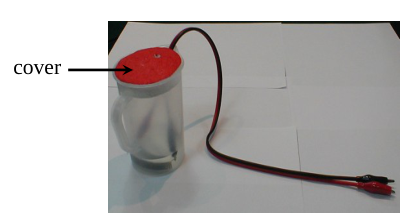
3\. Put the cover of cup on the top of the cup and make sure that it can seal the cup properly (See

figure below)


cover


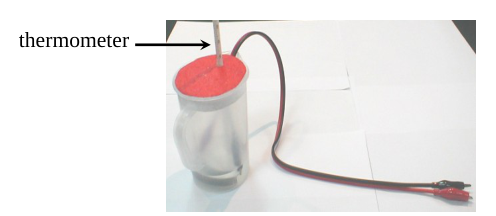
4\. Put the thermometer into the hole provided in the cover of cup (see figure below)


thermometer


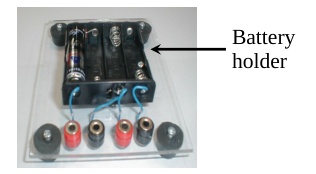
5\. Put one battery (1.5V) on the battery holder properly.

Battery
holder


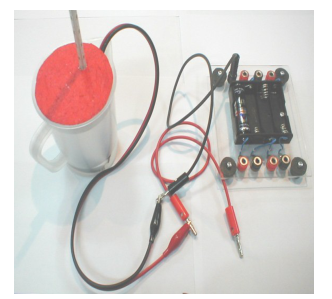
6\. Arrange the experimental apparatus according to the picture below.


7\. Measure the initial temperature of water in the plastics cup by using the thermometer provided.

Write down the measured temperature on the Table provided below.


8\. Connect the coil to the battery for 5 minutes. Disconnect coil and battery and then measure the

temperature of water by using the thermometer provided. Use the timer to measure the time.

Write down this measured temperature on the Table.


9\. Add one (1) battery serially to the circuit so that the voltage become 3.0 V and then repeat the

steps 7 and 8.


10\. Add one (1) more battery serially to the circuit so that the voltage become 4.5 V and then

repeat the steps 7 and 8 again.


11\. Calculate the difference between the temperature of water after 5 minutes heating and the

initial temperature for each voltage.


| No | Voltage (Volt) | Initial temperature of water (°C) | Temperature after 5 minutes Heating (°C) | Temperature Difference (°C) |
| --- | --- | --- | --- | --- |
| 1 | 1.5 | | | |
| 2 | 3.0 | | | |
| 3 | 4.5 | | | |

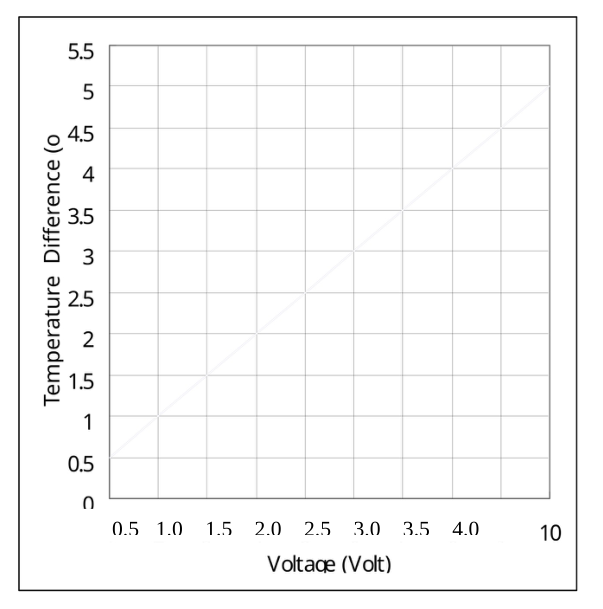
12\. Draw a graph of the temperature difference of water againts the change of the voltage.


0\.5 1.0 1.5 2.0 2.5 3.0 3.5 4.0


Analysis:

If the amount of water is 50ml and the voltage is 1.0 V, predict the temperature of water.


Question illustration

Question illustration

Question illustration

Question illustration

Question illustration

Question illustration