Question 17
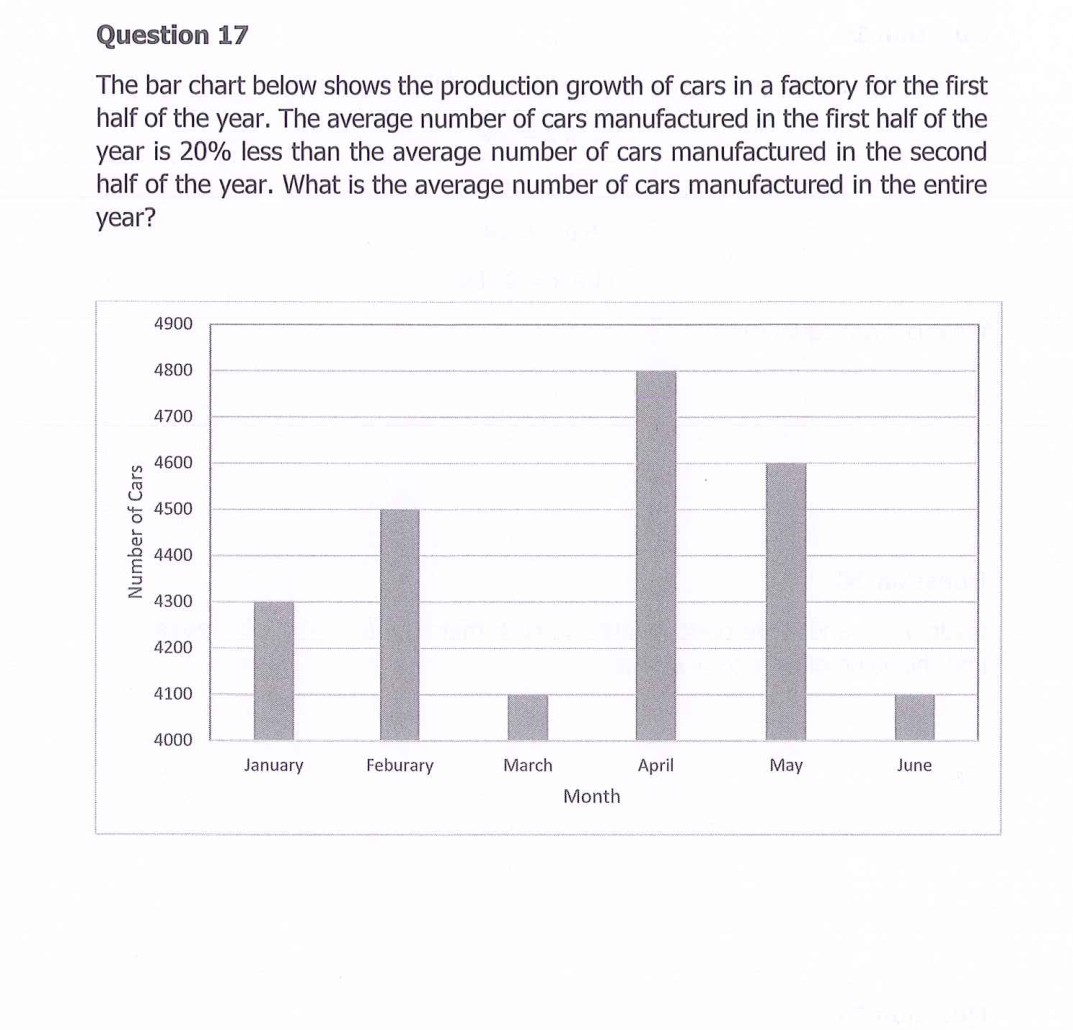
The bar chart below shows the production growth of cars in a factory for the first
i half of the year. The average number of cars manufactured in the first half of the
! year is 20% less than the average number of cars manufactured in the second
half of the year. What is the average number of cars manufactured in the entire
Sl year?
SS] | 4900 -— —— Se eee
aS 4800
SS] 4700
KS 2 4600
x 8 4500
i 8
SS zum
2 03 —
4200 i
4100
aS
so @ 2 EE
Sl January Feburary ‘March April May June
Month
E
i}
=
i half of the year. The average number of cars manufactured in the first half of the
! year is 20% less than the average number of cars manufactured in the second
half of the year. What is the average number of cars manufactured in the entire
Sl year?
SS] | 4900 -— —— Se eee
aS 4800
SS] 4700
KS 2 4600
x 8 4500
i 8
SS zum
2 03 —
4200 i
4100
aS
so @ 2 EE
Sl January Feburary ‘March April May June
Month
E
i}
=