Question 16
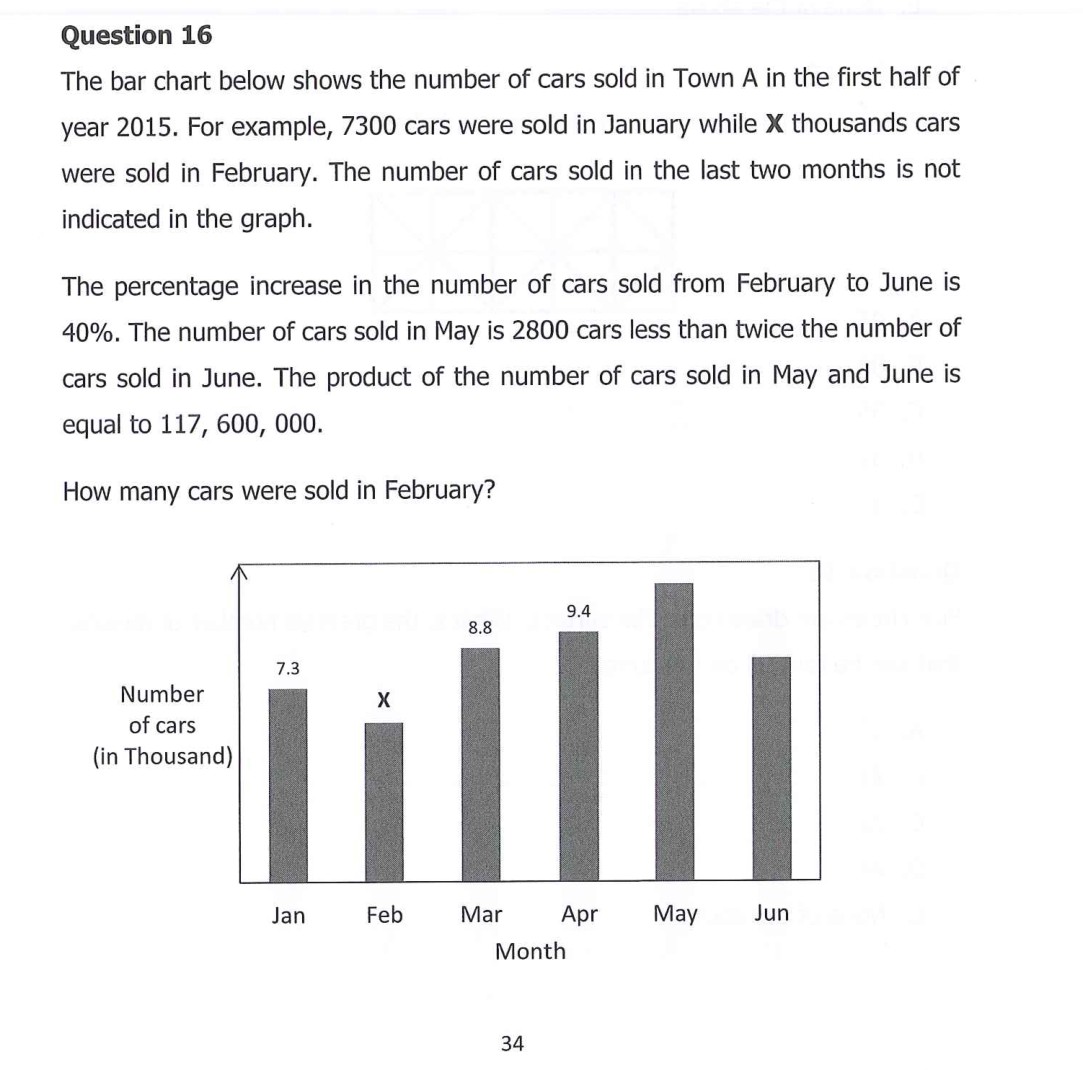
The bar chart below shows the number of cars sold in Town A in the first half of
year 2015. For example, 7300 cars were sold in January while X thousands cars
were sold in February. The number of cars sold in the last two months is not
indicated in the graph.
The percentage increase in the number of cars sold from February to June is
40%. The number of cars sold in May is 2800 cars less than twice the number of
cars sold in June. The product of the number of cars sold in May and June is
equal to 117, 600, 000.
How many cars were sold in February?
Number x
of cars
(in Thousand)
Jan Feb Mar Apr May Jun
Month
eee
=
&
SS ee ey
year 2015. For example, 7300 cars were sold in January while X thousands cars
were sold in February. The number of cars sold in the last two months is not
indicated in the graph.
The percentage increase in the number of cars sold from February to June is
40%. The number of cars sold in May is 2800 cars less than twice the number of
cars sold in June. The product of the number of cars sold in May and June is
equal to 117, 600, 000.
How many cars were sold in February?
Number x
of cars
(in Thousand)
Jan Feb Mar Apr May Jun
Month
eee
=
&
SS ee ey