Question 11
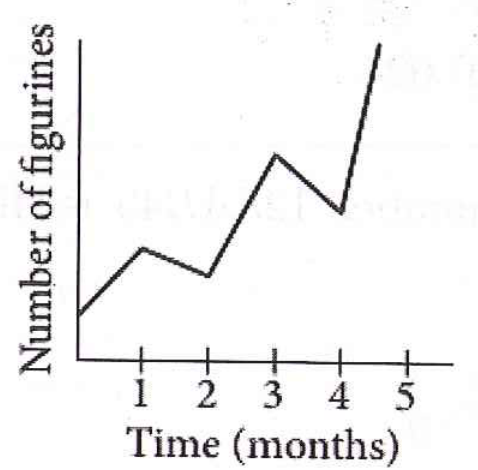
Tracy collects, sells, and trades figurines, and she tracks the number of figurines in her collection on the graph below.
On what interval did the number of figurines decrease the fastest?
A. Between January and February
B. Between February and March
C. Between March and April
D. Between April and May
E. None of the above
**Editorial note for this self-study exercise:** The time labels 1,2,3,4,5 represent January through May. Compare the downward slopes over equal one-month intervals. Enter only the option letter A, B, C, D or E.
On what interval did the number of figurines decrease the fastest?
A. Between January and February
B. Between February and March
C. Between March and April
D. Between April and May
E. None of the above
**Editorial note for this self-study exercise:** The time labels 1,2,3,4,5 represent January through May. Compare the downward slopes over equal one-month intervals. Enter only the option letter A, B, C, D or E.