Question 30
Original source text (the exact panel preserves diagram labels, tables and choices):
This graph shows the volume of product produced over time for 4 different
enzyme-catalyzed reactions. Between 0 s and 2 s, which of these 4 reactions has
the greatest average rate of production?
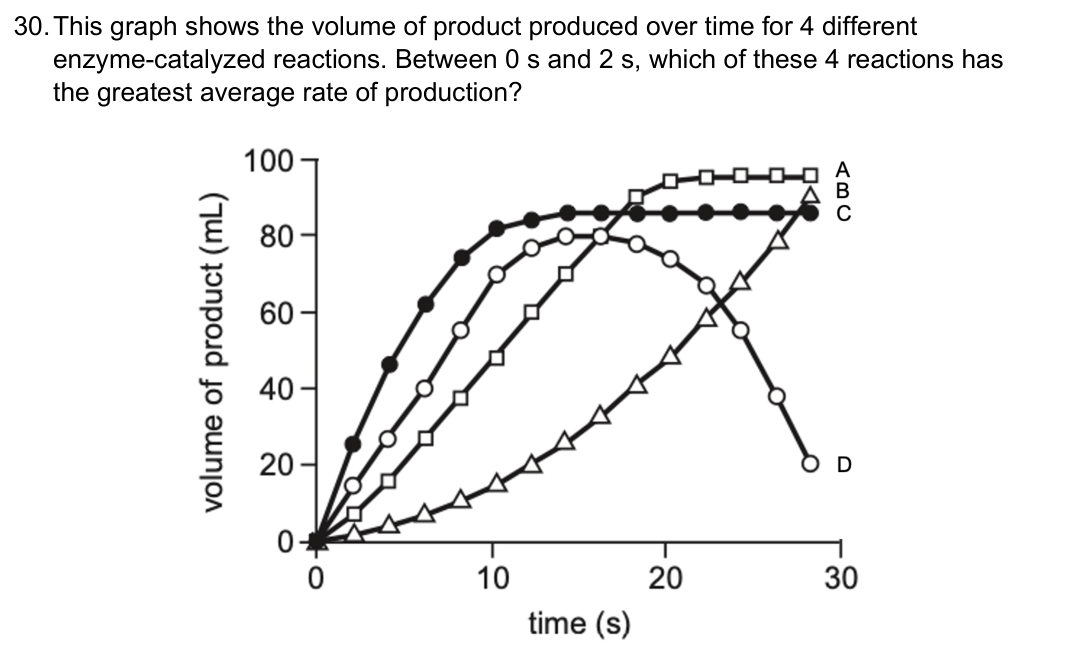
This graph shows the volume of product produced over time for 4 different
enzyme-catalyzed reactions. Between 0 s and 2 s, which of these 4 reactions has
the greatest average rate of production?