Question 1
Figure 1 below shows a potometer, an instrument designed to measure the rate of transpiration. A plant is positioned in a sealed water-filled container, which is connected to a graduated capillary tube. A bubble is then introduced into the capillary tube. As transpiration takes place, water is drawn up by the plant, causing the bubble to move. The position of the bubble in the tube shows the volume of water taken up by the plant over time.
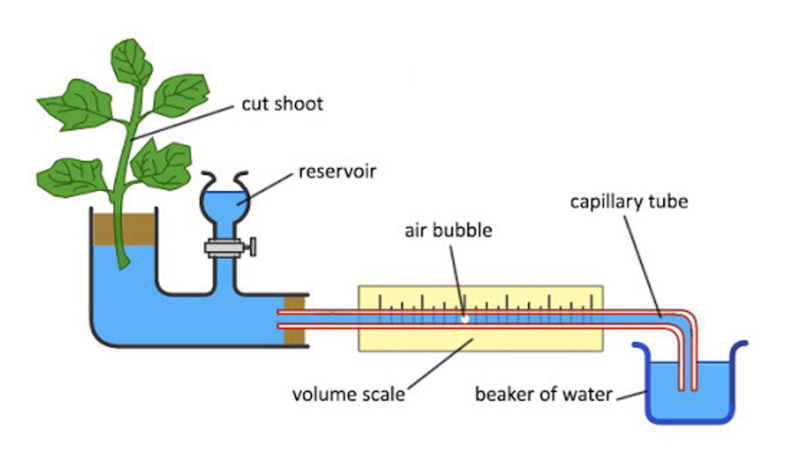
To investigate the transpiration rate of a specific spinach variety, scientists measured the water uptake by a young spinach plant at various temperatures. Water usage was recorded over the course of one hour for each temperature condition. Throughout the experiment, light intensity and humidity were maintained at constant levels. The results are presented in Table 1.
| Temperature (°C) | Water usage (mL/h) |
|---|---|
|10|0.05|
|15|0.08|
|20|0.13|
|25|0.18|
|30|1.2|
|34|1.8|
|40|2.4|
(a) Plot the data in Table 1 in a graph in the answer sheet. [2.5 marks]
(b) Based from the graph you created, at which temperature would you expect the plant to use 1.5 mL of water per hour? [1 mark]
(c) Transpiration rates are often expressed as volume of water lost per unit time per unit leaf area (i.e. mL/h/m²). If the total leaf area of this plant was found to be 0.05 m², calculate the transpiration rate of this plant at 30°C. [1 mark]
(d) Explain briefly the relationship between temperature and water usage. [1 mark]
To investigate the transpiration rate of a specific spinach variety, scientists measured the water uptake by a young spinach plant at various temperatures. Water usage was recorded over the course of one hour for each temperature condition. Throughout the experiment, light intensity and humidity were maintained at constant levels. The results are presented in Table 1.
| Temperature (°C) | Water usage (mL/h) |
|---|---|
|10|0.05|
|15|0.08|
|20|0.13|
|25|0.18|
|30|1.2|
|34|1.8|
|40|2.4|
(a) Plot the data in Table 1 in a graph in the answer sheet. [2.5 marks]
(b) Based from the graph you created, at which temperature would you expect the plant to use 1.5 mL of water per hour? [1 mark]
(c) Transpiration rates are often expressed as volume of water lost per unit time per unit leaf area (i.e. mL/h/m²). If the total leaf area of this plant was found to be 0.05 m², calculate the transpiration rate of this plant at 30°C. [1 mark]
(d) Explain briefly the relationship between temperature and water usage. [1 mark]