Question 2
IMSO 2022 · Indonesia · Science Experiment · 1 December 2022
2 experiments | 25 points | 150 minutes for the whole paper.
EXPERIMENT 2
Candy Chromatography: What Makes Those Colours?
Introduction
Almost all substances we come into contact with on a daily basis are impure; that is, they are mixtures. Similarly, compounds synthesized in the chemical laboratory are rarely produced pure.
Chromatography is first devised by Mikhail Tsivet in 1900 and is used to separate compounds within a mixture. This separation technique assumes a significant part in the medical and food industries.
In the battle against the Covid-19 pandemic, chromatography is a powerful laboratory-based analytical method that is being employed by researchers as the scientific community strives to understand the Sars-CoV-2 virus and develop better therapies, vaccines, and diagnostic tools. The SARS-CoV-2 Antigen Rapid Test (ART) is a rapid chromatographic immunoassay for the qualitative detection of specific antigens of SARS-CoV-2 present in the human nasopharynx.
Theoretical Knowledge
In paper chromatography, a drop of solution containing a substance or mixture of substances is spotted along a line near one end of a rectangular piece of filter paper. The paper is the stationary phase and the line is called the origin. The lower edge of the paper is placed in a developing solvent as the mobile phase. Capillary action causes the solvent to flow up the paper at a uniform rate creating a "wet" line across the paper. This line is called the solvent front.
It is possible to describe the position of spots (so the substances that have separated) in terms of their retention factor, the Rf value (Figure 1). The retention factor is defined as:
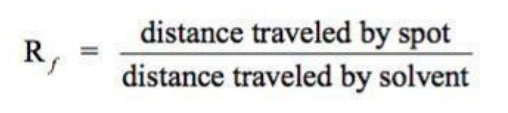
Accessible transcription: $R_f=\frac{\text{distance travelled by the substance from the origin}}{\text{distance travelled by the solvent front from the origin}}$.
Because the retention factor for a particular mixture varies depending on conditions, a sample of known composition is typically analyzed at the same time on the same sheet of paper or slide. The Rf value is a characteristic property of a given compound in a given solvent on a particular stationary phase.
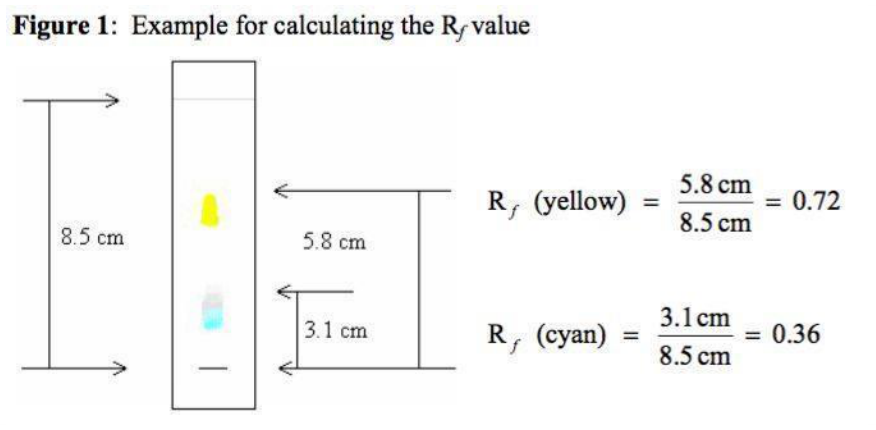
Figure 1: Example for calculating the Rf value. Solvent front: 8.5 cm from origin; yellow spot: 5.8 cm, Rf = 5.8/8.5 = 0.72 as printed; cyan spot: 3.1 cm, Rf = 3.1/8.5 = 0.36 as printed. Editorial note: the printed yellow result contains an arithmetic inconsistency; see the explanation. These are the source's illustrative values, not results for your candy.
Apparatus List
- 1 small pack of color coated chocolate candies (example M&M’s®)
- Filter paper
- Pen
- Pencil
- Ruler
- pipette (or dropper)
- petri dish or plastic lid (saucer)
- ice cream stick or toothpick
- binder clips (3 pcs)
- 100 mL beaker or glass container
- 500 mL beaker or glass container with a wide mouth (2 pcs)
- 1 Liter container
- Salt (sodium chloride)
- Teaspoon
- Measuring cup or cylinder
- Mass balance (optional)
- 1100 mL of pure water (non-mineralized)
- 200 mL 70% ethyl alcohol (disinfectant alcohol)
- Wooden splint or skewer sticks (3 pcs)
- Adhesive tape or glue to stick the chromatogram onto test paper for submission
- Paper towel or Tissue for cleaning and water spills
- Small trash bag
Procedure
Part 1: Preparing the chromatography strips
1\. Cut the coffee filter paper to make approximately 2 cm wide by 7.5 cm long strips. You will need at least 6 chromatography (coffee filter paper) strips.
2\. Draw a pencil line 1 cm from the edge of each strip of paper, as shown in Figure 2 below.
- This will be the origin line or baseline.
- You will spot the candy colour for each strip right on this line, as shown in Figure 3.
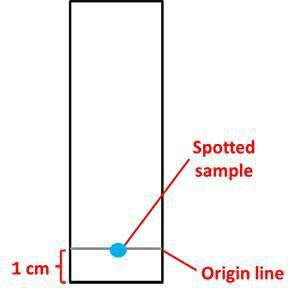
Figure 3: Each chromatography strip will have an origin line (baseline). The dye to be tested will be spotted in the middle of the origin line.
Editorial note: the source refers to Figure 2 here, but the supplied illustration is captioned Figure 3; the original numbering is preserved.
Part 2: Extract the candy dyes
3\. Choose three colors of candies you want to test.
- For example, you could test red, green and blue M&Ms®.
4\. Fill the 100 mL beaker with some water.
5\. Use the pipette (dropper) to put a single drop of water in the clean plate or plastic lid as shown in Figure 4 below. Set one candy in the drop of water.
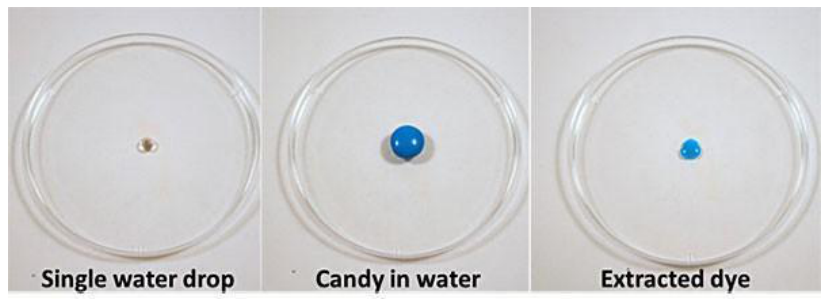
Figure 4. To extract the candy dye, leave a piece of candy in a single drop of water for three minutes. When you remove the candy, a puddle of dye will be left behind.
6\. Leave the candy in the drop of water for three minutes to allow the dye to dissolve.
7\. Remove the candy, then dip a pipette tip, clean ice cream stick or toothpick, into the now-coloured drop of water.
8\. Spot the candy dye solution onto the chromatography strip by touching the pipette tip, or a wooden splint, to the strip, right in the canter of the origin line as shown in Figure 5 below.
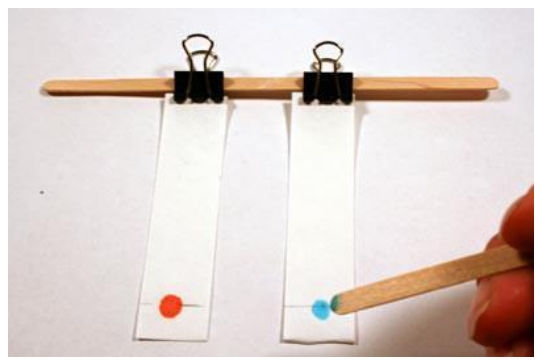
Figure 5. Spot the extracted candy dye onto the paper chromatography strips using the tip of a wooden splint or a pipette.
- Allow the spot on the strip to dry completely (this should take approximately 1 minute).
- Repeat step 8, 3–5 more times. You want to make sure to have enough dye on the chromatography strip so that you can see the dye components when they separate out on the paper.
9\. Repeat step 5 for the other two colours of candy you want to test.
Part 3: Set-up
10\. Prepare a 0.1% salt solution for the chromatography solvent.
- Add 1/8 teaspoon of salt to 4 cups of water (approximately 1 g of salt to 1 L of water).
- Shake or stir until the salt is completely dissolved.
11\. Pour a small amount of the salt solution into the 500 mL beaker.
12\. Clip two of the prepared chromatography strips to a wooden splint.
- Make sure the two strips do not touch each other or the beaker and that their bottoms are aligned.
- Rest the splint on top of the beaker so that the strips hang straight into the beaker.
- If necessary, add more of the salt solution. The goal is to have the end of the chromatography strips just touching the surface of the solvent solution (salt solution), as shown in Figure 6 below.
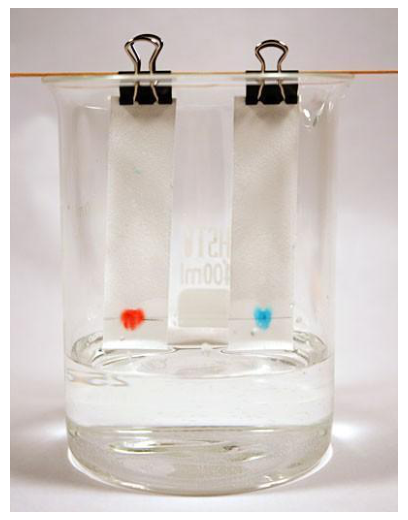
Figure 6. Your chromatography setup should look similar to this example. The edge of the chromatography strips should just barely touch the solvent.
13\. Let the solvent rise up the strip (by capillary action) until it is about 0.5 cm from the top then remove the strip from the solvent. Depending on the chromatography paper, this can take anywhere from 15–30 minutes. Regularly check on your chromatography strip and the solvent front—if you let it run too long the dye may run off the paper and become distorted.
- Be patient and do not take the paper strip out of the solvent early. The longer you keep the paper strip in the solvent, the better your separation will be!
14\. Use a pencil to mark how far the solvent rose.
15\. Allow the chromatography strip to dry, then measure (in centimeters) and calculate the Rf value for each candy color (or food coloring) dye component. Record your results in a table.
16\. Repeat steps 12–15 until you have run all of the chromatography strips.
- Each time you run the experiment make sure there is enough solvent in the beaker. Add more solvent (salt solution) as needed.
17\. Repeat steps 10–16 using a 70% ethyl alcohol as the solvent and one color only.
Part 4: Results
18\. Create a data table like Table 1 for each candy type and colour or food colouring that you have tested.
Colour of the candy: ____________________
Solvent used: ____________________
| Component Colour | Component Rf value |
| --- | --- |
| ________________ | ________________ |
| ________________ | ________________ |
| ________________ | ________________ |
| ________________ | ________________ |
Total number of components: ____________________ [2 marks]
Colour of the candy: ____________________
Solvent used: ____________________
| Component Colour | Component Rf value |
| --- | --- |
| ________________ | ________________ |
| ________________ | ________________ |
| ________________ | ________________ |
Total number of components: ____________________ [2 marks]
Colour of the candy: ____________________
Solvent used: ____________________
| Component Colour | Component Rf value |
| --- | --- |
| ________________ | ________________ |
| ________________ | ________________ |
| ________________ | ________________ |
Total number of components: ____________________ [2 marks]
Colour of the candy: ____________________
Solvent used: 70% Ethyl Alcohol
| Component Colour | Component Rf value |
| --- | --- |
| ________________ | ________________ |
| ________________ | ________________ |
| ________________ | ________________ |
| ________________ | ________________ |
Total number of components: ____________________ [2 marks]
Stick the Chromatogram here and label them properly:
[Blank submission area: attach and label all actual chromatograms.]
Part 5: Cleaning
19\. Clean and fix your table with a paper towel and alcohol.
Questions
1\. Why do you think some dyes separate into different colours while others do not? [1]
2\. Why do you think some colours move further up the paper than others? [1]
3\. Why is it necessary that the solvent level be below the origin line? [1]
4\. Why is it not recommended to use a pen to draw the origin line? [1]
5\. Can you think of any way of improving the separation between the different spots? [1]
6\. Look on the side of the packet of the chocolate candy for a list of the coloured dyes used. Try to identify which dyes correspond to the spots on the chromatogram. [1]
END OF EXPERIMENTS
Editorial safety note: Work with adult supervision. Avoid burns from hot water in Experiment 1. Ethanol is flammable: keep it away from flames, sparks and heat; use ventilation and avoid eye contact. Do not eat experimental candies or drink any solutions. Follow local laboratory safety and disposal instructions. For step 17, replace the salt solution with 70% ethanol; do not add the step-10 salt recipe to ethanol.
2 experiments | 25 points | 150 minutes for the whole paper.
EXPERIMENT 2
Candy Chromatography: What Makes Those Colours?
Introduction
Almost all substances we come into contact with on a daily basis are impure; that is, they are mixtures. Similarly, compounds synthesized in the chemical laboratory are rarely produced pure.
Chromatography is first devised by Mikhail Tsivet in 1900 and is used to separate compounds within a mixture. This separation technique assumes a significant part in the medical and food industries.
In the battle against the Covid-19 pandemic, chromatography is a powerful laboratory-based analytical method that is being employed by researchers as the scientific community strives to understand the Sars-CoV-2 virus and develop better therapies, vaccines, and diagnostic tools. The SARS-CoV-2 Antigen Rapid Test (ART) is a rapid chromatographic immunoassay for the qualitative detection of specific antigens of SARS-CoV-2 present in the human nasopharynx.
Theoretical Knowledge
In paper chromatography, a drop of solution containing a substance or mixture of substances is spotted along a line near one end of a rectangular piece of filter paper. The paper is the stationary phase and the line is called the origin. The lower edge of the paper is placed in a developing solvent as the mobile phase. Capillary action causes the solvent to flow up the paper at a uniform rate creating a "wet" line across the paper. This line is called the solvent front.
It is possible to describe the position of spots (so the substances that have separated) in terms of their retention factor, the Rf value (Figure 1). The retention factor is defined as:
Accessible transcription: $R_f=\frac{\text{distance travelled by the substance from the origin}}{\text{distance travelled by the solvent front from the origin}}$.
Because the retention factor for a particular mixture varies depending on conditions, a sample of known composition is typically analyzed at the same time on the same sheet of paper or slide. The Rf value is a characteristic property of a given compound in a given solvent on a particular stationary phase.
Figure 1: Example for calculating the Rf value. Solvent front: 8.5 cm from origin; yellow spot: 5.8 cm, Rf = 5.8/8.5 = 0.72 as printed; cyan spot: 3.1 cm, Rf = 3.1/8.5 = 0.36 as printed. Editorial note: the printed yellow result contains an arithmetic inconsistency; see the explanation. These are the source's illustrative values, not results for your candy.
Apparatus List
- 1 small pack of color coated chocolate candies (example M&M’s®)
- Filter paper
- Pen
- Pencil
- Ruler
- pipette (or dropper)
- petri dish or plastic lid (saucer)
- ice cream stick or toothpick
- binder clips (3 pcs)
- 100 mL beaker or glass container
- 500 mL beaker or glass container with a wide mouth (2 pcs)
- 1 Liter container
- Salt (sodium chloride)
- Teaspoon
- Measuring cup or cylinder
- Mass balance (optional)
- 1100 mL of pure water (non-mineralized)
- 200 mL 70% ethyl alcohol (disinfectant alcohol)
- Wooden splint or skewer sticks (3 pcs)
- Adhesive tape or glue to stick the chromatogram onto test paper for submission
- Paper towel or Tissue for cleaning and water spills
- Small trash bag
Procedure
Part 1: Preparing the chromatography strips
1\. Cut the coffee filter paper to make approximately 2 cm wide by 7.5 cm long strips. You will need at least 6 chromatography (coffee filter paper) strips.
2\. Draw a pencil line 1 cm from the edge of each strip of paper, as shown in Figure 2 below.
- This will be the origin line or baseline.
- You will spot the candy colour for each strip right on this line, as shown in Figure 3.
Figure 3: Each chromatography strip will have an origin line (baseline). The dye to be tested will be spotted in the middle of the origin line.
Editorial note: the source refers to Figure 2 here, but the supplied illustration is captioned Figure 3; the original numbering is preserved.
Part 2: Extract the candy dyes
3\. Choose three colors of candies you want to test.
- For example, you could test red, green and blue M&Ms®.
4\. Fill the 100 mL beaker with some water.
5\. Use the pipette (dropper) to put a single drop of water in the clean plate or plastic lid as shown in Figure 4 below. Set one candy in the drop of water.
Figure 4. To extract the candy dye, leave a piece of candy in a single drop of water for three minutes. When you remove the candy, a puddle of dye will be left behind.
6\. Leave the candy in the drop of water for three minutes to allow the dye to dissolve.
7\. Remove the candy, then dip a pipette tip, clean ice cream stick or toothpick, into the now-coloured drop of water.
8\. Spot the candy dye solution onto the chromatography strip by touching the pipette tip, or a wooden splint, to the strip, right in the canter of the origin line as shown in Figure 5 below.
Figure 5. Spot the extracted candy dye onto the paper chromatography strips using the tip of a wooden splint or a pipette.
- Allow the spot on the strip to dry completely (this should take approximately 1 minute).
- Repeat step 8, 3–5 more times. You want to make sure to have enough dye on the chromatography strip so that you can see the dye components when they separate out on the paper.
9\. Repeat step 5 for the other two colours of candy you want to test.
Part 3: Set-up
10\. Prepare a 0.1% salt solution for the chromatography solvent.
- Add 1/8 teaspoon of salt to 4 cups of water (approximately 1 g of salt to 1 L of water).
- Shake or stir until the salt is completely dissolved.
11\. Pour a small amount of the salt solution into the 500 mL beaker.
12\. Clip two of the prepared chromatography strips to a wooden splint.
- Make sure the two strips do not touch each other or the beaker and that their bottoms are aligned.
- Rest the splint on top of the beaker so that the strips hang straight into the beaker.
- If necessary, add more of the salt solution. The goal is to have the end of the chromatography strips just touching the surface of the solvent solution (salt solution), as shown in Figure 6 below.
Figure 6. Your chromatography setup should look similar to this example. The edge of the chromatography strips should just barely touch the solvent.
13\. Let the solvent rise up the strip (by capillary action) until it is about 0.5 cm from the top then remove the strip from the solvent. Depending on the chromatography paper, this can take anywhere from 15–30 minutes. Regularly check on your chromatography strip and the solvent front—if you let it run too long the dye may run off the paper and become distorted.
- Be patient and do not take the paper strip out of the solvent early. The longer you keep the paper strip in the solvent, the better your separation will be!
14\. Use a pencil to mark how far the solvent rose.
15\. Allow the chromatography strip to dry, then measure (in centimeters) and calculate the Rf value for each candy color (or food coloring) dye component. Record your results in a table.
16\. Repeat steps 12–15 until you have run all of the chromatography strips.
- Each time you run the experiment make sure there is enough solvent in the beaker. Add more solvent (salt solution) as needed.
17\. Repeat steps 10–16 using a 70% ethyl alcohol as the solvent and one color only.
Part 4: Results
18\. Create a data table like Table 1 for each candy type and colour or food colouring that you have tested.
Colour of the candy: ____________________
Solvent used: ____________________
| Component Colour | Component Rf value |
| --- | --- |
| ________________ | ________________ |
| ________________ | ________________ |
| ________________ | ________________ |
| ________________ | ________________ |
Total number of components: ____________________ [2 marks]
Colour of the candy: ____________________
Solvent used: ____________________
| Component Colour | Component Rf value |
| --- | --- |
| ________________ | ________________ |
| ________________ | ________________ |
| ________________ | ________________ |
Total number of components: ____________________ [2 marks]
Colour of the candy: ____________________
Solvent used: ____________________
| Component Colour | Component Rf value |
| --- | --- |
| ________________ | ________________ |
| ________________ | ________________ |
| ________________ | ________________ |
Total number of components: ____________________ [2 marks]
Colour of the candy: ____________________
Solvent used: 70% Ethyl Alcohol
| Component Colour | Component Rf value |
| --- | --- |
| ________________ | ________________ |
| ________________ | ________________ |
| ________________ | ________________ |
| ________________ | ________________ |
Total number of components: ____________________ [2 marks]
Stick the Chromatogram here and label them properly:
[Blank submission area: attach and label all actual chromatograms.]
Part 5: Cleaning
19\. Clean and fix your table with a paper towel and alcohol.
Questions
1\. Why do you think some dyes separate into different colours while others do not? [1]
2\. Why do you think some colours move further up the paper than others? [1]
3\. Why is it necessary that the solvent level be below the origin line? [1]
4\. Why is it not recommended to use a pen to draw the origin line? [1]
5\. Can you think of any way of improving the separation between the different spots? [1]
6\. Look on the side of the packet of the chocolate candy for a list of the coloured dyes used. Try to identify which dyes correspond to the spots on the chromatogram. [1]
END OF EXPERIMENTS
Editorial safety note: Work with adult supervision. Avoid burns from hot water in Experiment 1. Ethanol is flammable: keep it away from flames, sparks and heat; use ventilation and avoid eye contact. Do not eat experimental candies or drink any solutions. Follow local laboratory safety and disposal instructions. For step 17, replace the salt solution with 70% ethanol; do not add the step-10 salt recipe to ethanol.