Question 4
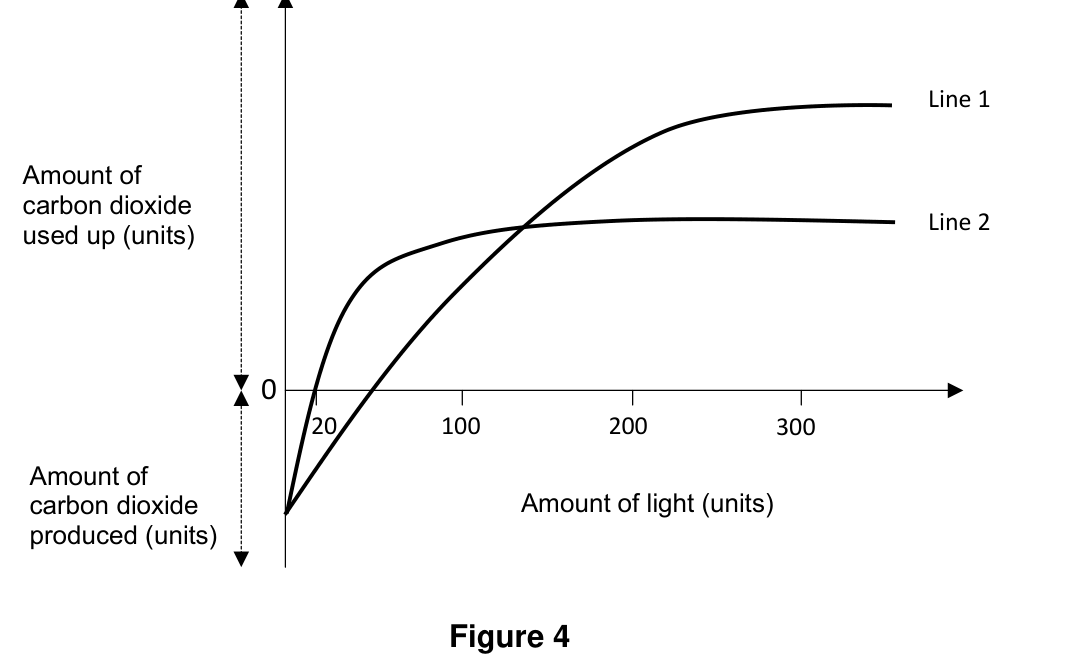
Figure 4 shows the amount of carbon dioxide used up or produced in two types of green plants, Plant A and Plant B. Plant A is adapted to make the most food under bright light while Plant B is adapted to make the most food under dim or low light conditions.
(a) What can you deduce about the rate of photosynthesis and respiration in the plants when line 1 and line 2 are below the horizontal axis?
(b) Which line on the graph represents Plant A? Explain using the graph.
(c) What two adaptations are most likely to be found in Plant B? Tick the correct options in the Answer Booklet: single layer of leaves; multiple layers of leaves; low density of chloroplasts; high density of chloroplasts.
(a) What can you deduce about the rate of photosynthesis and respiration in the plants when line 1 and line 2 are below the horizontal axis?
(b) Which line on the graph represents Plant A? Explain using the graph.
(c) What two adaptations are most likely to be found in Plant B? Tick the correct options in the Answer Booklet: single layer of leaves; multiple layers of leaves; low density of chloroplasts; high density of chloroplasts.