Question 20
Two species with the same food requirements remain in the same community. Which graph would most likely describe the relative population of the two species over time?
Choose from graphs A–D in the original figure.
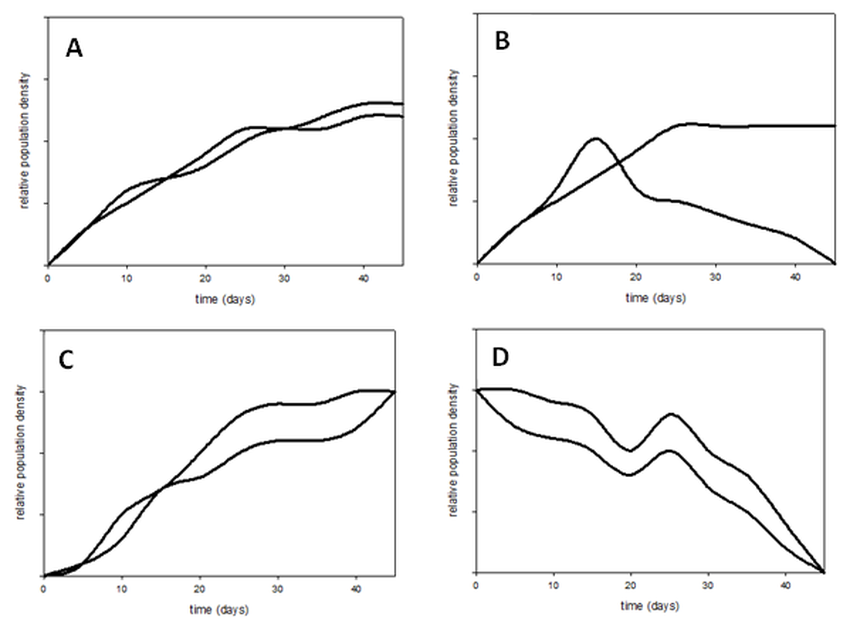
Choose from graphs A–D in the original figure.