Question 1
### Introduction of The Experiment.
Gold Fish is one of popular fish in Indonesia. It is a favorite fish for ornamental fish tank. Scientist identified that the reproduction of gold fish is influenced by photoperiodic or water aeration. However the effect of both factor is not know yet. You are asked to design an experiment about the effect of photoperiodic, water aeration or both of them.
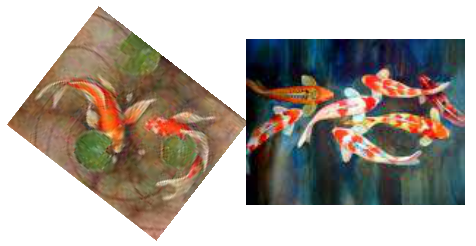
### A. THESE ARE SOME MATERIALS YOU MAY NEED TO SIMULATE THE EXPERIMENT :
| Material | Quantity |
| --- | --- |
| Blue paper | 1 |
| Green paper | 1 |
| Yellow paper | 1 |
| Coin | 2 |
| Goldfish card | 100 |
### B. TASK
1. Design an experiment to show relationship between both environment factors.
- You can use blue paper for pond with aeration system, green paper for pond with photoperiodic system and yellow paper for pond having both systems
- You can use two coins to simulate the increasing number of individual fish on the paper. If you toss the two coins together, they will appear in three different combinations :
- a. Picture - number will represent additional of two fishes on the blue paper
- b. Number - number will represent additional of two fishes on the green paper
- c. Picture - picture will represent additional two of fishes on the yellow paper
- Write the number of fishes you use for each paper at the beginning of the experiment:
- a. Blue paper: ___
- b. Green paper: ___
- c. Yellow paper: ___
2. You should toss the coins together for 30 times.
3. You may put the goldfish-card on corresponding paper based on the result of tossing and record your result on the table at the answer sheet.
4. After you finish with the experiment save the goldfish card from each paper into different bag and labeled
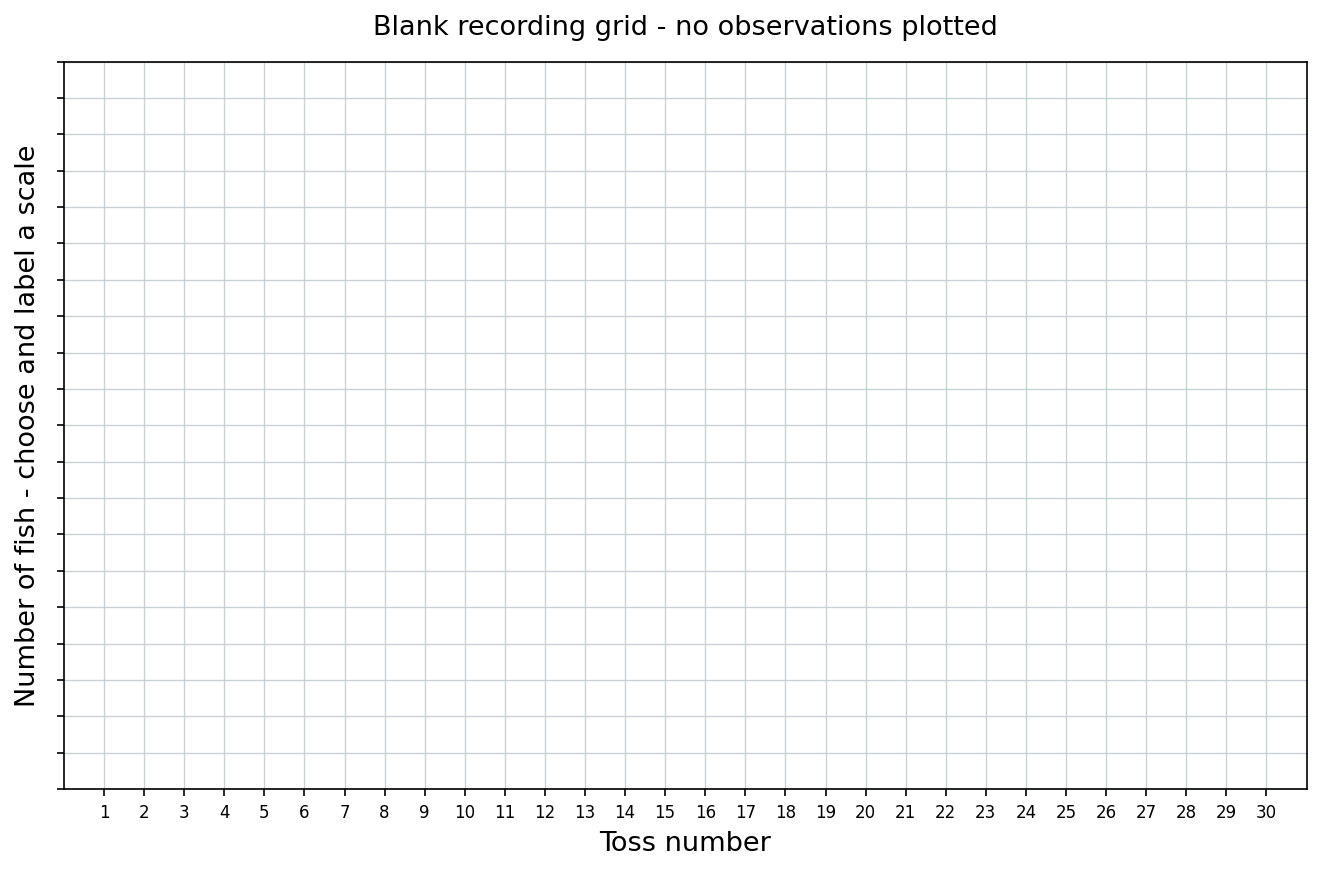
5. Make a graph based on the table of your result. Total number of gold fish in the population should be written on the Y-axis and the toss result should be written on the X-axis (indicate/label the line you use)
### Based on your experiment, answer the following question :
1. Which pond has the highest number population after 30 tosses?
2. What factor is responsible for promoting the reproduction of gold fish
3. What factor is not repress the reproduction of the population of gold fish? Explain.
4. The weakness of this experiment is ……. Explain your answer.
### Answer-sheet table, faithfully redrawn
The original answer sheet uses “Number of fish”/“Number of individual” beside “Total number of fish in the population”. After the initial row, the first column for each colour records the number added on that toss, not the cumulative total. Record your actual tosses. These blanks are not observed data.
| Toss | Blue: added | Blue: total | Green: added | Green: total | Yellow: added | Yellow: total |
| --- | --- | --- | --- | --- | --- | --- |
| Beginning | ___ | ___ | ___ | ___ | ___ | ___ |
| 1 | ___ | ___ | ___ | ___ | ___ | ___ |
| 2 | ___ | ___ | ___ | ___ | ___ | ___ |
| 3 | ___ | ___ | ___ | ___ | ___ | ___ |
| 4 | ___ | ___ | ___ | ___ | ___ | ___ |
| 5 | ___ | ___ | ___ | ___ | ___ | ___ |
| 6 | ___ | ___ | ___ | ___ | ___ | ___ |
| 7 | ___ | ___ | ___ | ___ | ___ | ___ |
| 8 | ___ | ___ | ___ | ___ | ___ | ___ |
| 9 | ___ | ___ | ___ | ___ | ___ | ___ |
| 10 | ___ | ___ | ___ | ___ | ___ | ___ |
| 11 | ___ | ___ | ___ | ___ | ___ | ___ |
| 12 | ___ | ___ | ___ | ___ | ___ | ___ |
| 13 | ___ | ___ | ___ | ___ | ___ | ___ |
| 14 | ___ | ___ | ___ | ___ | ___ | ___ |
| 15 | ___ | ___ | ___ | ___ | ___ | ___ |
| 16 | ___ | ___ | ___ | ___ | ___ | ___ |
| 17 | ___ | ___ | ___ | ___ | ___ | ___ |
| 18 | ___ | ___ | ___ | ___ | ___ | ___ |
| 19 | ___ | ___ | ___ | ___ | ___ | ___ |
| 20 | ___ | ___ | ___ | ___ | ___ | ___ |
| 21 | ___ | ___ | ___ | ___ | ___ | ___ |
| 22 | ___ | ___ | ___ | ___ | ___ | ___ |
| 23 | ___ | ___ | ___ | ___ | ___ | ___ |
| 24 | ___ | ___ | ___ | ___ | ___ | ___ |
| 25 | ___ | ___ | ___ | ___ | ___ | ___ |
| 26 | ___ | ___ | ___ | ___ | ___ | ___ |
| 27 | ___ | ___ | ___ | ___ | ___ | ___ |
| 28 | ___ | ___ | ___ | ___ | ___ | ___ |
| 29 | ___ | ___ | ___ | ___ | ___ | ___ |
| 30 | ___ | ___ | ___ | ___ | ___ | ___ |
### Graph sheet, bilingual redraw
Choose an appropriate vertical scale and label the three lines. The original grid is preserved with the source materials and in the source-answer section.
**Editorial practical note:** This is a paper-and-coin simulation; do not replace it with experiments on live fish. Keep small coins/cards away from young children and keep the work surface clear. No completed observations have been supplied by this conversion.
Gold Fish is one of popular fish in Indonesia. It is a favorite fish for ornamental fish tank. Scientist identified that the reproduction of gold fish is influenced by photoperiodic or water aeration. However the effect of both factor is not know yet. You are asked to design an experiment about the effect of photoperiodic, water aeration or both of them.
### A. THESE ARE SOME MATERIALS YOU MAY NEED TO SIMULATE THE EXPERIMENT :
| Material | Quantity |
| --- | --- |
| Blue paper | 1 |
| Green paper | 1 |
| Yellow paper | 1 |
| Coin | 2 |
| Goldfish card | 100 |
### B. TASK
1. Design an experiment to show relationship between both environment factors.
- You can use blue paper for pond with aeration system, green paper for pond with photoperiodic system and yellow paper for pond having both systems
- You can use two coins to simulate the increasing number of individual fish on the paper. If you toss the two coins together, they will appear in three different combinations :
- a. Picture - number will represent additional of two fishes on the blue paper
- b. Number - number will represent additional of two fishes on the green paper
- c. Picture - picture will represent additional two of fishes on the yellow paper
- Write the number of fishes you use for each paper at the beginning of the experiment:
- a. Blue paper: ___
- b. Green paper: ___
- c. Yellow paper: ___
2. You should toss the coins together for 30 times.
3. You may put the goldfish-card on corresponding paper based on the result of tossing and record your result on the table at the answer sheet.
4. After you finish with the experiment save the goldfish card from each paper into different bag and labeled
5. Make a graph based on the table of your result. Total number of gold fish in the population should be written on the Y-axis and the toss result should be written on the X-axis (indicate/label the line you use)
### Based on your experiment, answer the following question :
1. Which pond has the highest number population after 30 tosses?
2. What factor is responsible for promoting the reproduction of gold fish
3. What factor is not repress the reproduction of the population of gold fish? Explain.
4. The weakness of this experiment is ……. Explain your answer.
### Answer-sheet table, faithfully redrawn
The original answer sheet uses “Number of fish”/“Number of individual” beside “Total number of fish in the population”. After the initial row, the first column for each colour records the number added on that toss, not the cumulative total. Record your actual tosses. These blanks are not observed data.
| Toss | Blue: added | Blue: total | Green: added | Green: total | Yellow: added | Yellow: total |
| --- | --- | --- | --- | --- | --- | --- |
| Beginning | ___ | ___ | ___ | ___ | ___ | ___ |
| 1 | ___ | ___ | ___ | ___ | ___ | ___ |
| 2 | ___ | ___ | ___ | ___ | ___ | ___ |
| 3 | ___ | ___ | ___ | ___ | ___ | ___ |
| 4 | ___ | ___ | ___ | ___ | ___ | ___ |
| 5 | ___ | ___ | ___ | ___ | ___ | ___ |
| 6 | ___ | ___ | ___ | ___ | ___ | ___ |
| 7 | ___ | ___ | ___ | ___ | ___ | ___ |
| 8 | ___ | ___ | ___ | ___ | ___ | ___ |
| 9 | ___ | ___ | ___ | ___ | ___ | ___ |
| 10 | ___ | ___ | ___ | ___ | ___ | ___ |
| 11 | ___ | ___ | ___ | ___ | ___ | ___ |
| 12 | ___ | ___ | ___ | ___ | ___ | ___ |
| 13 | ___ | ___ | ___ | ___ | ___ | ___ |
| 14 | ___ | ___ | ___ | ___ | ___ | ___ |
| 15 | ___ | ___ | ___ | ___ | ___ | ___ |
| 16 | ___ | ___ | ___ | ___ | ___ | ___ |
| 17 | ___ | ___ | ___ | ___ | ___ | ___ |
| 18 | ___ | ___ | ___ | ___ | ___ | ___ |
| 19 | ___ | ___ | ___ | ___ | ___ | ___ |
| 20 | ___ | ___ | ___ | ___ | ___ | ___ |
| 21 | ___ | ___ | ___ | ___ | ___ | ___ |
| 22 | ___ | ___ | ___ | ___ | ___ | ___ |
| 23 | ___ | ___ | ___ | ___ | ___ | ___ |
| 24 | ___ | ___ | ___ | ___ | ___ | ___ |
| 25 | ___ | ___ | ___ | ___ | ___ | ___ |
| 26 | ___ | ___ | ___ | ___ | ___ | ___ |
| 27 | ___ | ___ | ___ | ___ | ___ | ___ |
| 28 | ___ | ___ | ___ | ___ | ___ | ___ |
| 29 | ___ | ___ | ___ | ___ | ___ | ___ |
| 30 | ___ | ___ | ___ | ___ | ___ | ___ |
### Graph sheet, bilingual redraw
Choose an appropriate vertical scale and label the three lines. The original grid is preserved with the source materials and in the source-answer section.
**Editorial practical note:** This is a paper-and-coin simulation; do not replace it with experiments on live fish. Keep small coins/cards away from young children and keep the work surface clear. No completed observations have been supplied by this conversion.