Question 16
Which graph below shows an object slowing down?
Original source panel (all diagram labels and choices preserved):
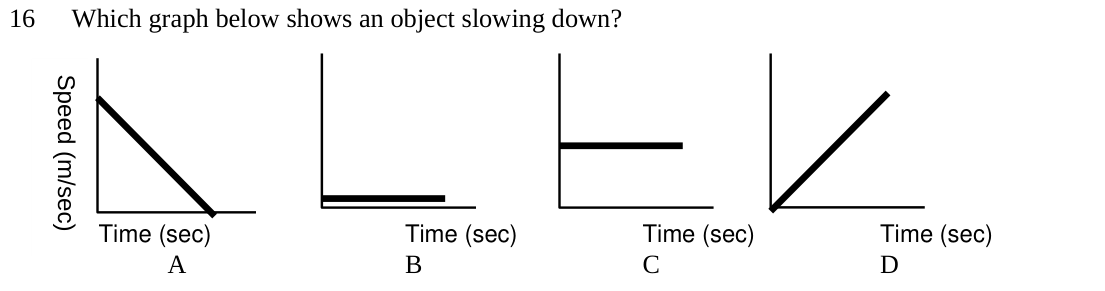
Original source panel (all diagram labels and choices preserved):
IMSO Science · IMSO 2005 Science Taiwan Selection Second Round — Theory I