Question 14
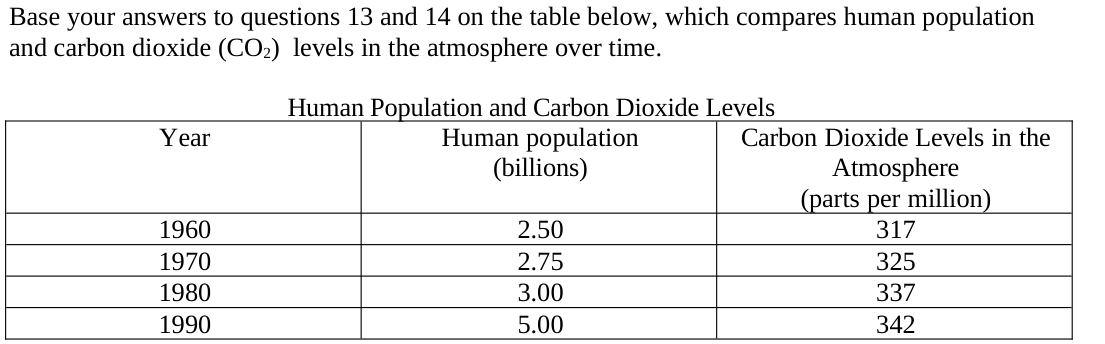
Base your answers to questions 13 and 14 on the table below, which compares human population and carbon dioxide (CO₂) levels in the atmosphere over time.
**Human Population and Carbon Dioxide Levels**
|Year|Human population (billions)|Carbon dioxide in atmosphere (parts per million)|
|---|---|---|
|1960|2.50|317|
|1970|2.75|325|
|1980|3.00|337|
|1990|5.00|342|
Which human activity might explain the change in carbon dioxide levels shown in the graph?
Original source panel (all diagram labels and choices preserved):

**Human Population and Carbon Dioxide Levels**
|Year|Human population (billions)|Carbon dioxide in atmosphere (parts per million)|
|---|---|---|
|1960|2.50|317|
|1970|2.75|325|
|1980|3.00|337|
|1990|5.00|342|
Which human activity might explain the change in carbon dioxide levels shown in the graph?
Original source panel (all diagram labels and choices preserved):