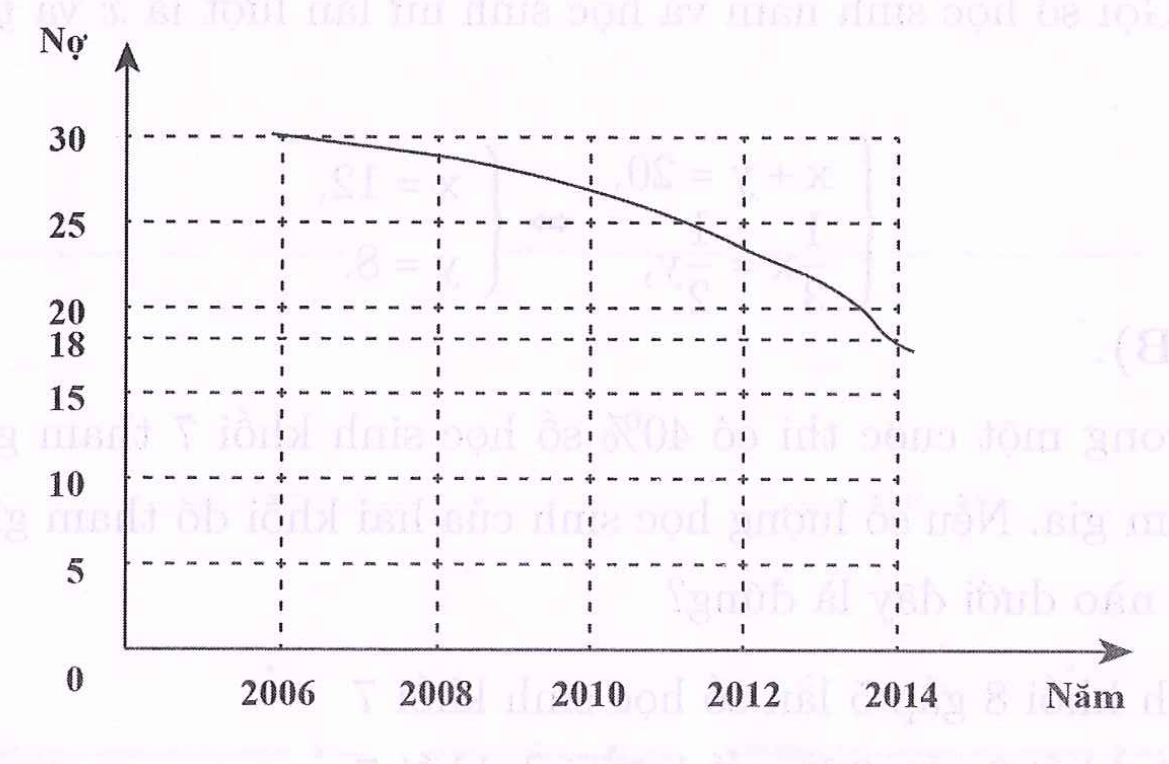
Question 25The graph shows Kangonland’s national debt, in billions of EUR, from 2006 to 2014. What is the percentage decrease between 2006 and 2014? 12%18%30%40%60%