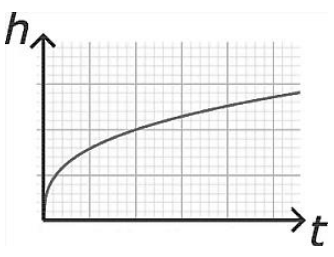
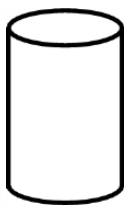
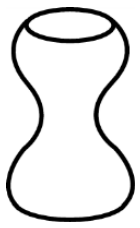
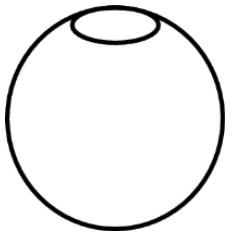
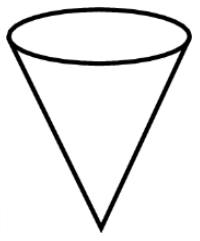
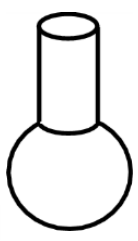
Question 12The five vases shown are filled with water. The filling rate is constant. For which of the five vases does the graph shown describe the height of the water h as a function of the time t?