Skip to content / Đến nội dung
ThichHocToan.com

AMC8 2027 - Self-practice Set 2 Question 8

AMC8 · AMC8 2027 - Self-practice Set 2

Question 8

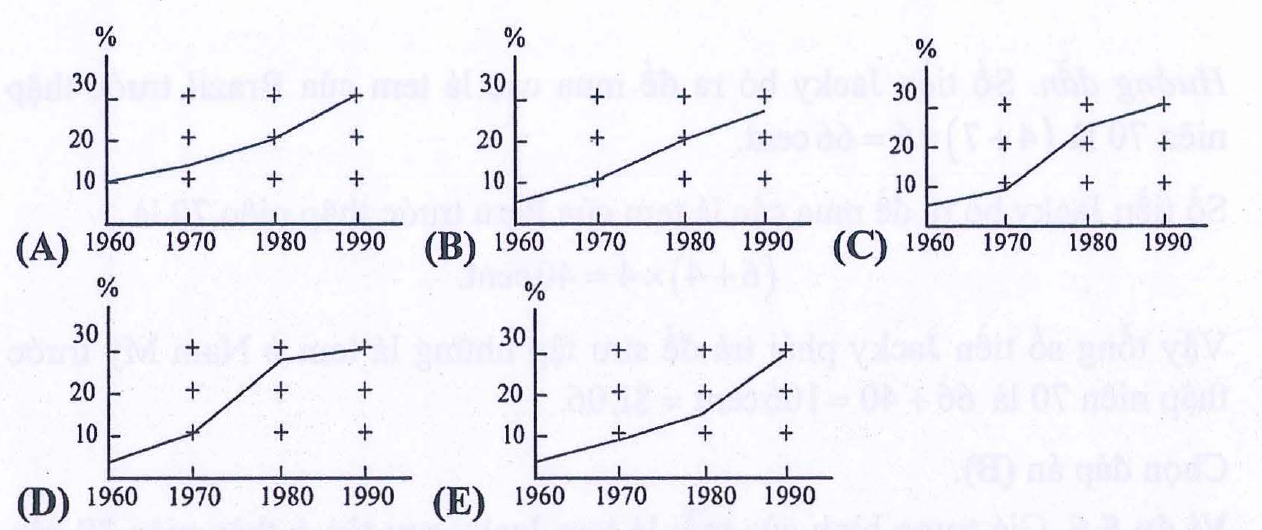
The percentages working from home in 1960, 1970, 1980, 1990 are 5%, 8%, 15%, 30%. Which illustrated graph represents these values best?

Question illustration
  1. Graph A
  2. Graph B
  3. Graph C
  4. Graph D
  5. Graph E