VIAMC 2025 Mock Test — Level 5 (Intermediate) Question 10
VIAMC · VIAMC 2025 Mock Test — Level 5 (Intermediate)
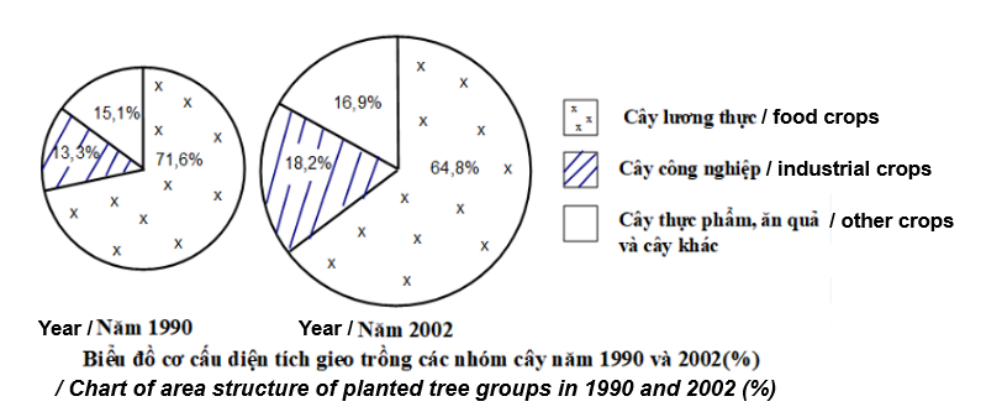
Below is a chart of the structure of planted areas for different crop groups in our country in 1990 and 2002. From 1990 to 2002, which of the following statements is true?
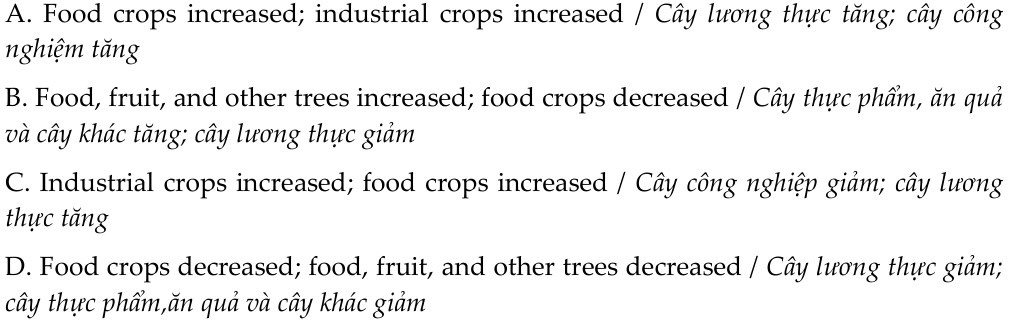
Food crops increased; industrial crops increased
Food, fruit and other trees increased; food crops decreased
Industrial crops increased; food crops increased
Food crops decreased; food, fruit and other trees decreased