Question 7
This graph shows the temperature throughout the school day, but part of it has been hidden. The hottest part of the day is at 2 pm. What does the missing section of the graph look like?
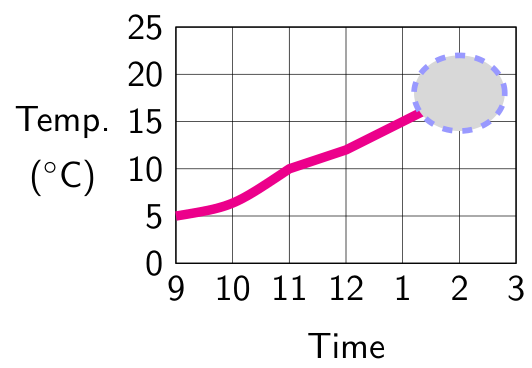

The vertical axis is temperature in °C; the horizontal axis is time.
The vertical axis is temperature in °C; the horizontal axis is time.