Question 19
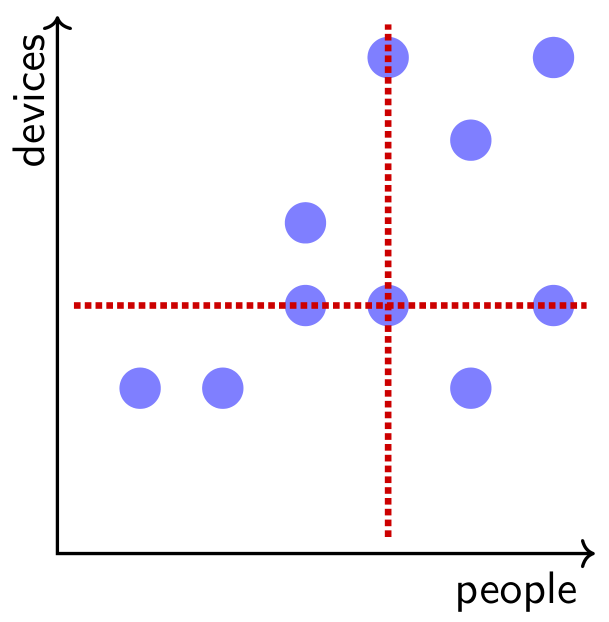
A researcher surveys 10 households and creates this scatterplot showing how many people and how many internet-connected devices are in each house. To help categorise her data, she adds a vertical line representing the median number of people and a horizontal line representing the median number of devices. One extra household is surveyed and the results are added to the scatterplot. What will happen to the median lines?