Question 5
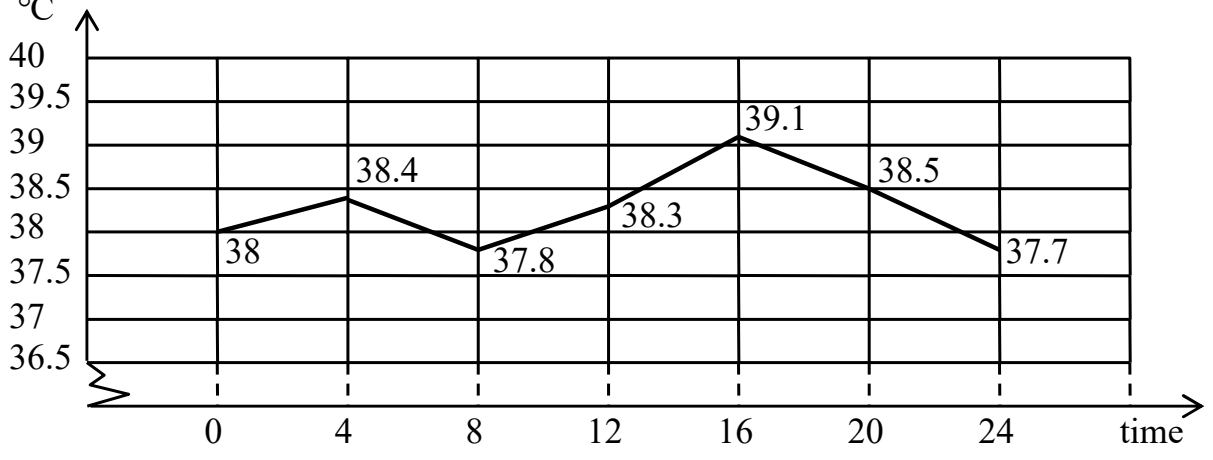
The figure below plots the body temperature records of one patient in a day. The records started at 00:00 AM and were taken every 4 hours. After how many hours did the patient recorded his highest temperature?
IMAS · IMAS 2017 — Upper Primary Grades 5–6 — Round 1