Question 11
The chart below shows the sale figures of a certain merchandise in 2014 and 2015 by the season. How many more items were sold in 2015 than in 2014?
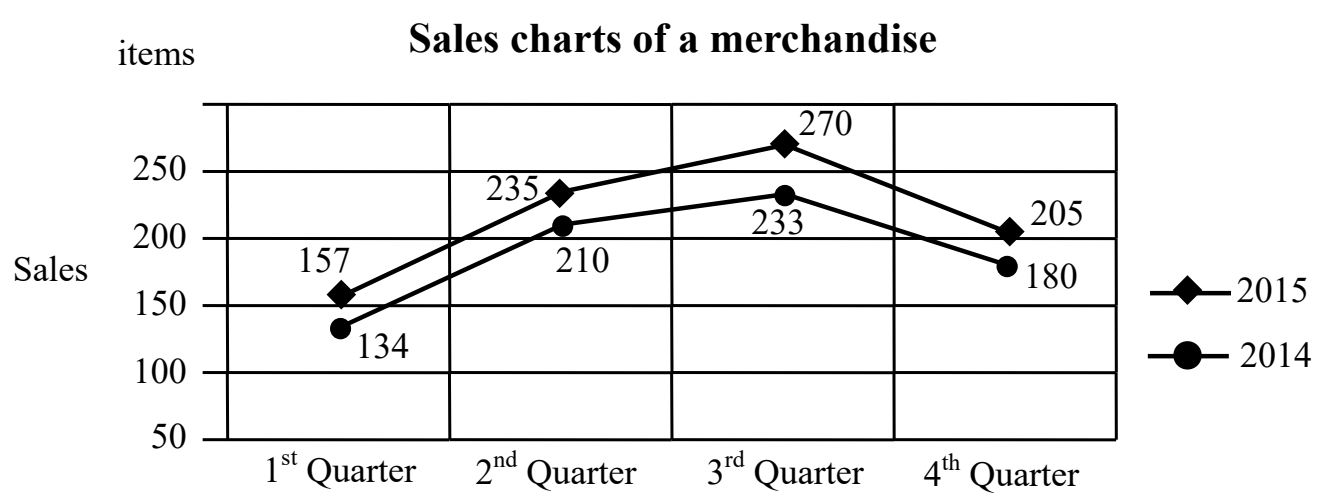
Chart legend:diamonds2015,circles2014; horizontal axis:quarters1–4; vertical axis:sales in items.
Chart legend:diamonds2015,circles2014; horizontal axis:quarters1–4; vertical axis:sales in items.