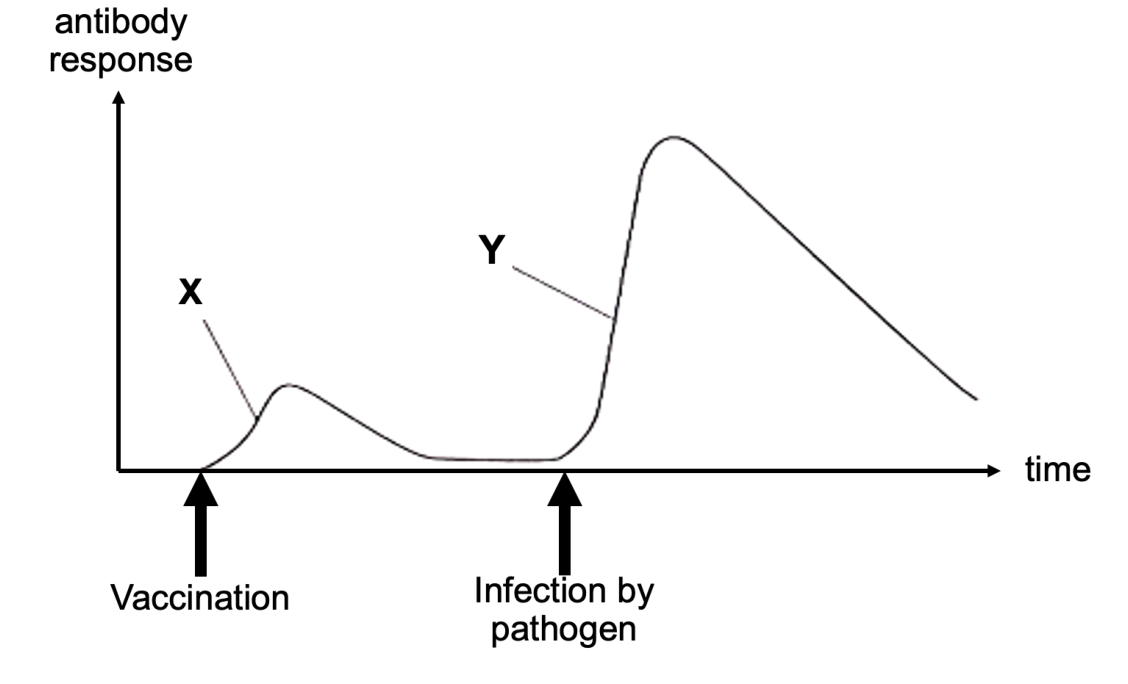
Joshua caught the flu and his body slowly produced antibodies to fight the virus.
A few months later, Joshua was given a vaccine for the same virus. This time, his
body responded much faster and made more antibodies. The graph below shows
the two immune responses X and Y of Joshua following two occurrences.
a. What are two things/occurrences that can make Joshua’s body produce
antibodies? [1 mark]
b. Why does not Joshua get the symptoms after getting vaccinated? [1 mark]
c. How is Joshua’s second response Y different from his first response X?
[1 mark]
d. Even when Joshua’s antibody level goes down, how can his body still fight
the virus in the future? [1 mark]
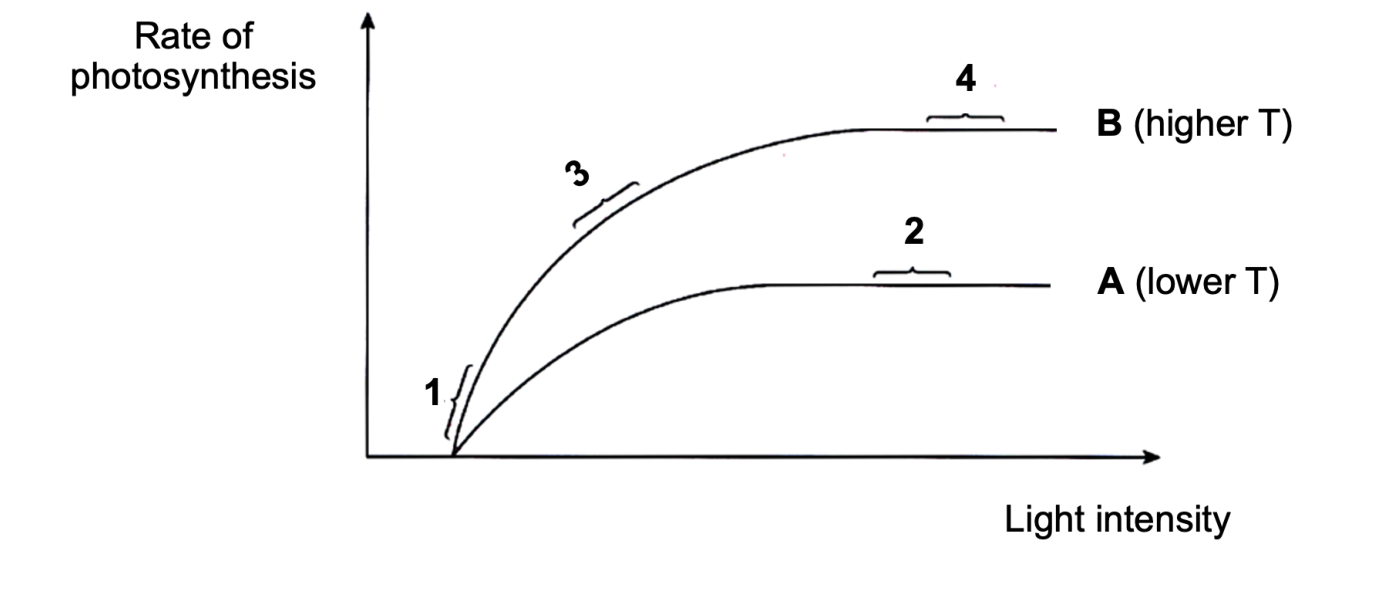
The graph below shows the results of the effect of light intensity on a plant’s rate
of photosynthesis at two different temperatures, T. Curve A was obtained from a
plant kept at lower temperature, while curve B was obtained from a plant kept at
a higher temperature.
a. State the factor which was affecting the rate of photosynthesis at regions 1 and
3 on the graph. Justify your answer. [2 marks]
b. Explain what influences the data gathered at region 2. [2 marks]
c. Other than the factor which you have mentioned in your answer for Question
2a, state ONE other factor that affects the rate of photosynthesis. [1 mark]
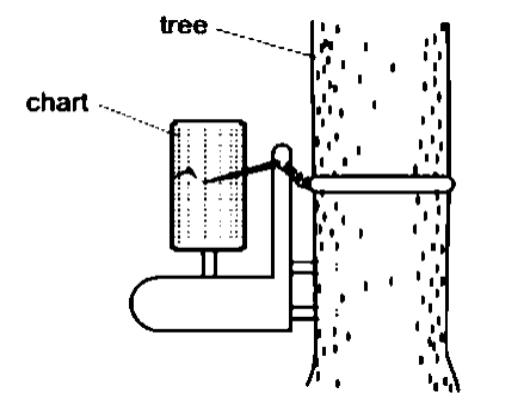
A study was conducted to investigate the relationship between transpiration and
changes in a tree's stem diameter. A dendrograph was used to continuously
measure the stem's diameter over a period of time, as shown in the figure below.
Fig. 1
Data were collected in the following table:
| Time of the day | Stem diameter (mm) |
|---|---:|
| 6:00 | 4.6 |
| 12:00 | 4.0 |
| 18:00 | 4.6 |
| 24:00 | 5.0 |
| 6:00 | 4.6 |
| 12:00 | 4.0 |
| 18:00 | 4.6 |
| 24:00 | 5.0 |
| 6:00 | 4.6 |
a. Using the provided data, create a line graph that illustrates the change in the
tree's stem diameter over time. [2 marks]
b. Using the provided data, describe the overall pattern of change in the tree's
stem diameter over the 24-hour period. [2 marks]
c. Provide a scientific explanation for the pattern observed during the night.
[2 marks]
You have a balloon that has been blown up and then released without tying the
end. The balloon moves forward as the air rushes out.
a. What type of energy is stored in a balloon when it is blown up? [1 mark]
b. Assume that the balloon and the escaping air have a combined mass of 0.05
kg. After the balloon is released, it reaches a velocity of 8 m/s in air. Calculate
the kinetic energy of the balloon at this velocity. [2 marks]
c. If the balloon were released in a vacuum, would you expect the kinetic energy
of the balloon to be greater than, less than, or the same as the kinetic energy
calculated in Part b? Explain your answer. [2 marks]
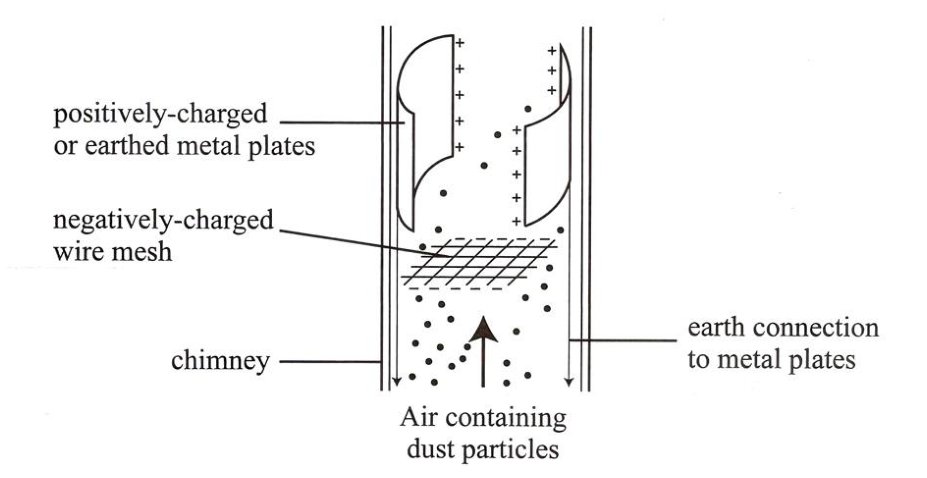
Dust removal from air can be achieved by means of an electric field. When air
containing dust particles passes through a fine wire mesh, the particles become
negatively charged. Subsequently, the air is directed between two positively
charged metal plates, where the charged dust particles are attracted and collected,
as illustrated in the figure below.
a. Explain how the dust particles become negatively charged when they pass
through the wire mesh. [2 marks]
b. Explain what happens to the dust particles as they pass through the electric
field. [2 marks]
c. Complete the diagram to show the electric field between two dust particles
before they entered the electric field. Use three arrows to show the
behavior of the particles. [1 marks]
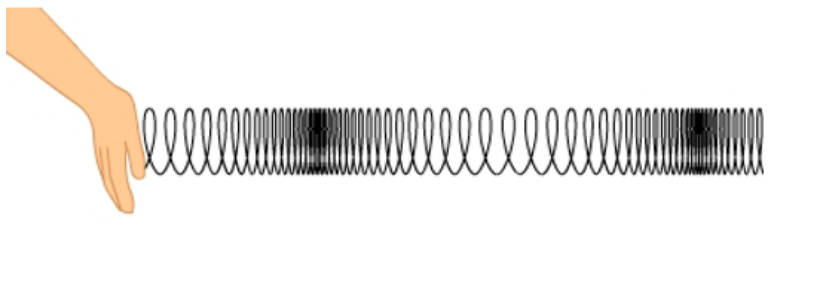
In a Physics lesson, Mr. Wong demonstrates wave motion using a slinky. One
end of the slinky is fixed to the wall, while the other end is moved repeatedly from
side to side. This motion produces a wave that propagates along the slinky with
a constant speed. The diagram below represents the slinky at a particular instant
in time.
a. On the diagram below, indicate a compression by labeling it with C, and a
rarefaction by labeling it with R. [1 mark]
b. On the same diagram, identify and mark a distance equivalent to one
wavelength, and denote it with the symbol λ. [1 mark]
c. If Mr. Wong doubles the speed of his hand movement, what effect will this
have on the wavelength? What does this observation reveal about the
relationship between wavelength and frequency? [2 marks]
d. Provide one real-world example of a wave that resembles the motion of the
slinky. [1 mark]
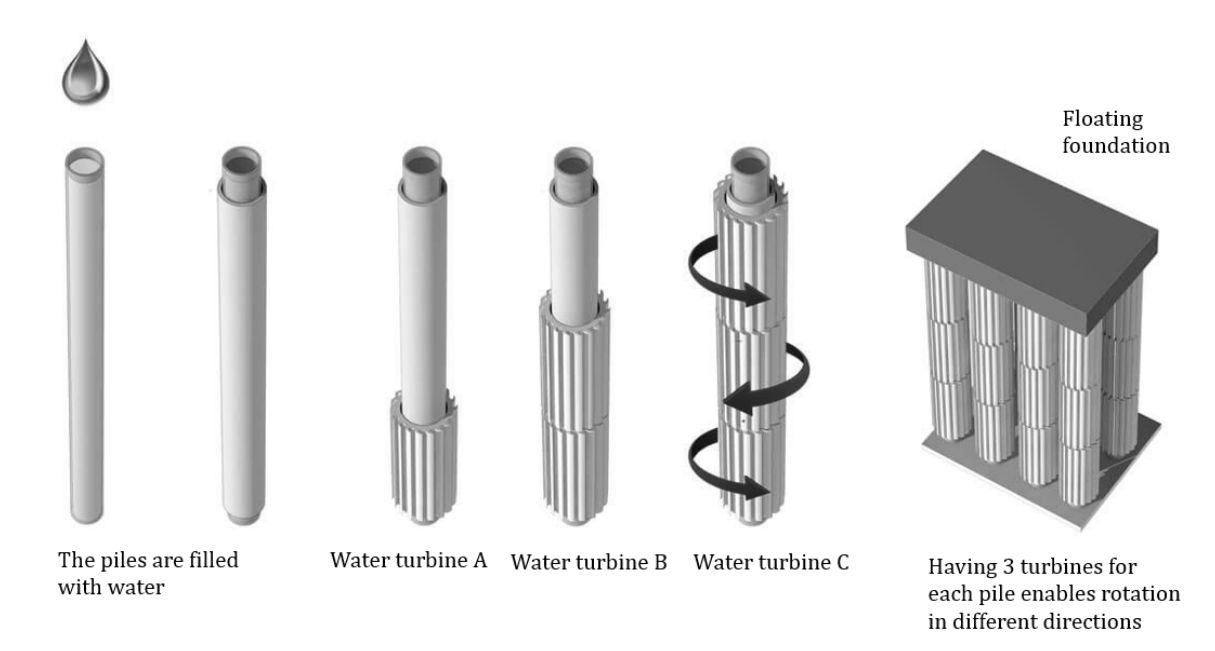
The diagram below shows a futuristic design for a seawall that functions also as
an energy generator. It is designed to be used together with battery technology.
The sites considered can be coastal areas like a river mouth or urban coastal
areas.
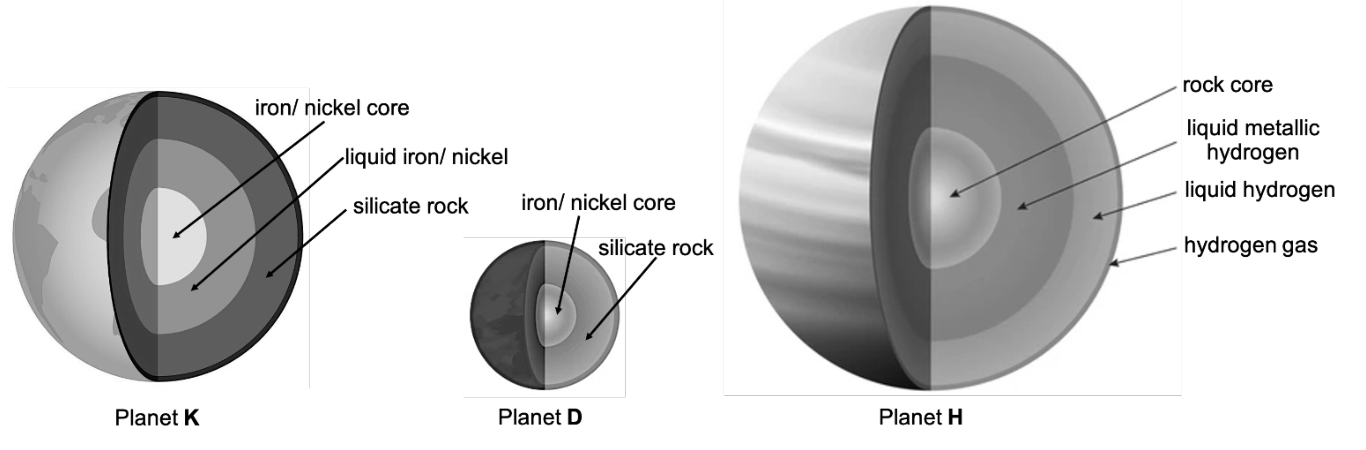
The figures below are unnamed planets K, D, and H and their internal
composition. These are not drawn to scale.
a. Compare the three planets. Identify one (1) similarity that all three share, and
explain one (1) major difference (2 marks)
b. The planets can be classified into two main groups. Propose a classification
scheme based on the figure and justify your reasoning by referring to both
composition and observable physical properties. (2 marks)
c. Planet H has a rock core surrounded by liquid metallic hydrogen and liquid
hydrogen. Suggest how this internal structure might influence Planet H’s
strong magnetic field compared to Planet K and Planet D. (2 marks)
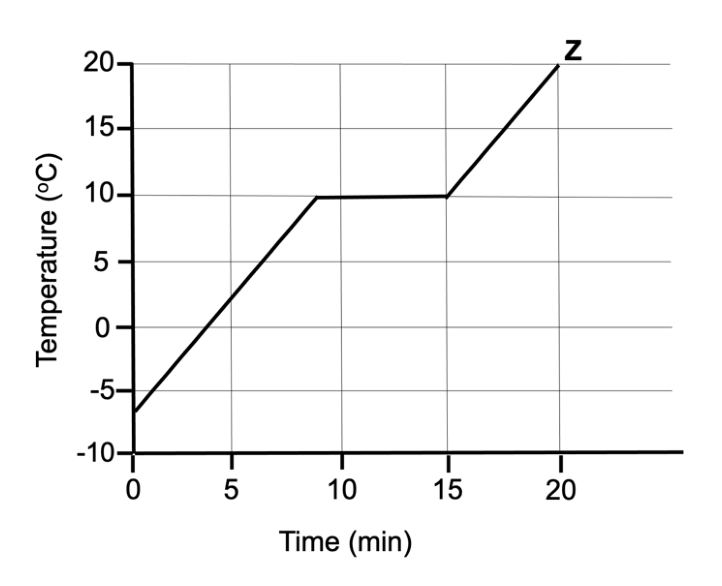
A student performs an experiment to determine the melting point of an unknown
solid substance G. She takes the substance in a beaker and starts heating. She
immersed a thermometer into the beaker and noted the change in temperature
every minute. She then plotted the change in temperature of the substance against
time and obtained a graph like below:
a. What is the melting point of substance G in degrees Celsius? (1 mark)
b. Why does the temperature remain constant from 9th min to 15th min of the
experiment? (1.5 marks)
c. Using (O) to represent particles of substance G, draw at least ten particles as
they would appear at point Z. (1 mark)
d. If we allow the same sample of the same compound to cool down, draw the
resulting graph. (1.5 marks)