Skip to content / Đến nội dung
ThichHocToan.com

IMSO 2005 Science Taiwan Selection Second Round — Theory I

Question 1

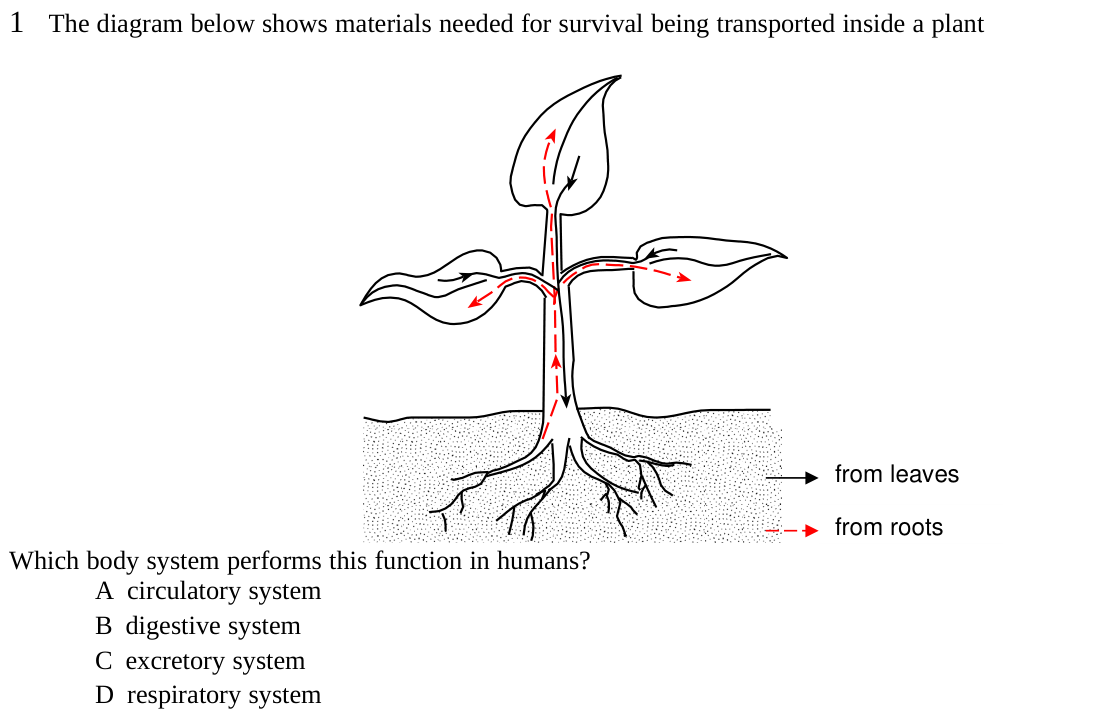
The diagram below shows materials needed for survival being transported inside a plant.

Which body system performs this function in humans?

Original source panel (all diagram labels and choices preserved):
Question illustration
  1. circulatory system
  2. digestive system
  3. excretory system
  4. respiratory system

Question 2

The energy content of food is measured in

Original source panel (all diagram labels and choices preserved):

Question illustration
  1. ounces
  2. degrees
  3. grams
  4. Calories

Question 3

The solid part of Earth’s surface is called the

Original source panel (all diagram labels and choices preserved):

Question illustration
  1. hydrosphere
  2. lithosphere
  3. troposphere
  4. atmosphere

Question 4

A rock that contains fossil seashells was most likely formed as a result of

Original source panel (all diagram labels and choices preserved):

Question illustration
  1. volcanic activity
  2. sedimentation
  3. heat and pressure
  4. magma cooling

Question 5

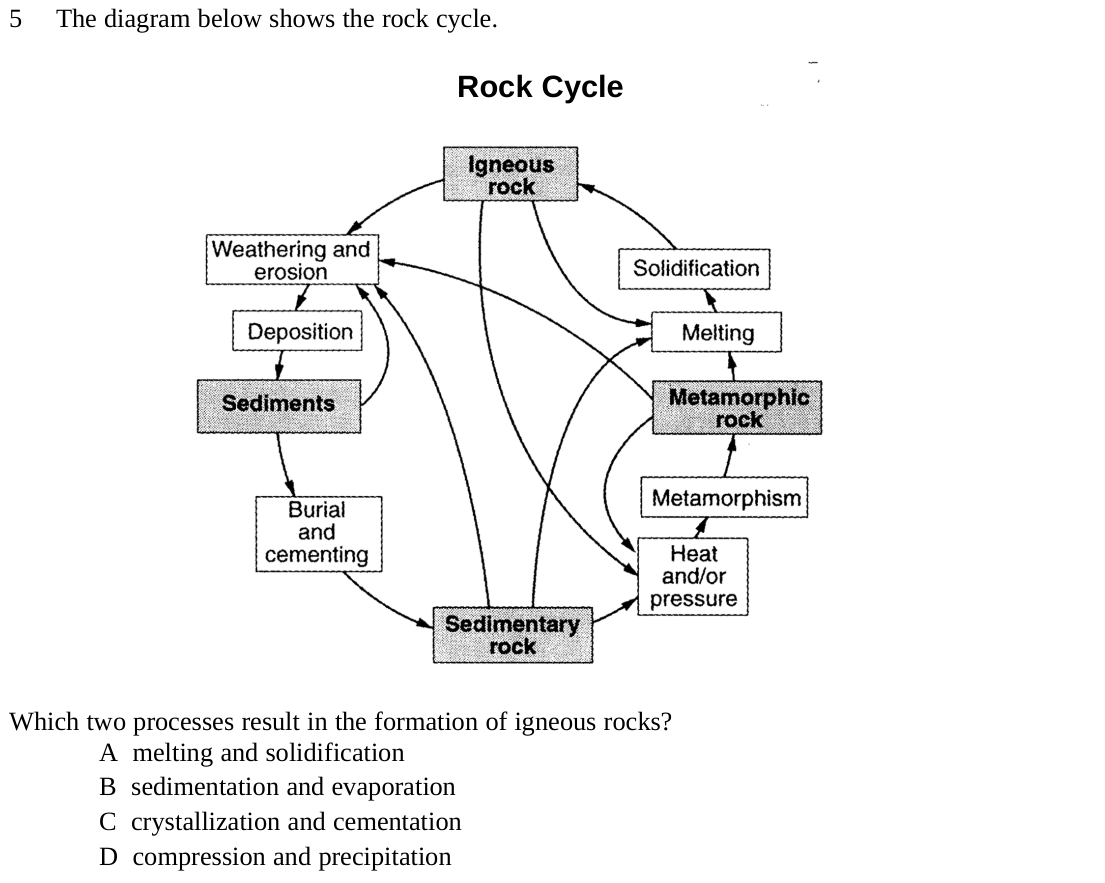
The diagram below shows the rock cycle.

Which two processes result in the formation of igneous rocks?

Original source panel (all diagram labels and choices preserved):
Question illustration
  1. melting and solidification
  2. sedimentation and evaporation
  3. crystallization and cementation
  4. compression and precipitation

Question 6

As ice cream melts, its molecules

A. absorb heat energy and move farther apart

B. absorb heat energy and move closer together

C. release heat energy and move farther apart

D. release heat energy and move closer together

Original source panel (all diagram labels and choices preserved):

Question illustration

Question 7

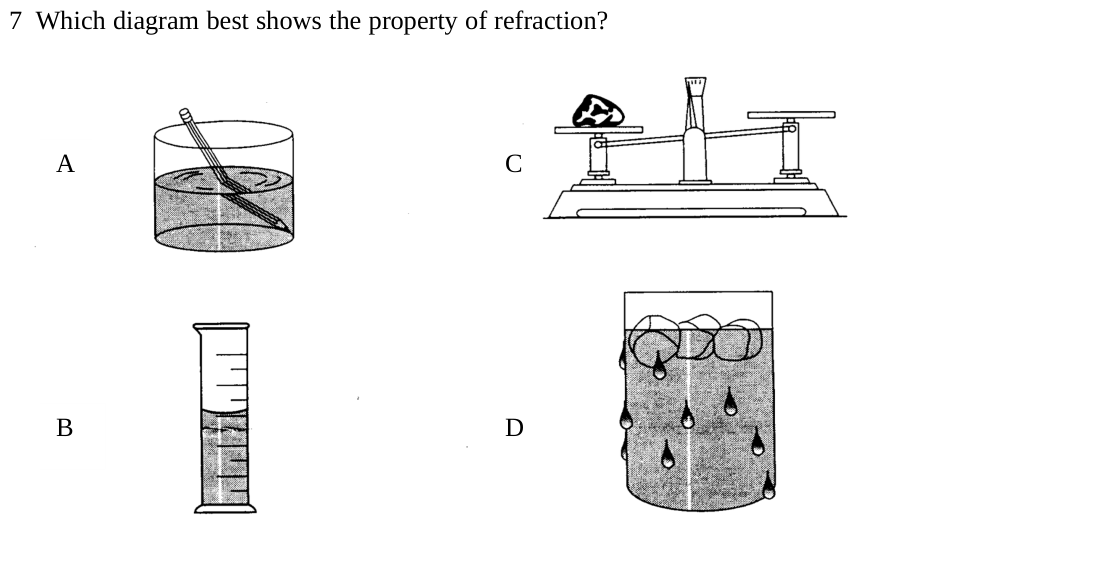
Which diagram best shows the property of refraction?

Original source panel (all diagram labels and choices preserved):
Question illustration
  1. Original diagram A
  2. Original diagram B
  3. Original diagram C
  4. Original diagram D

Question 8

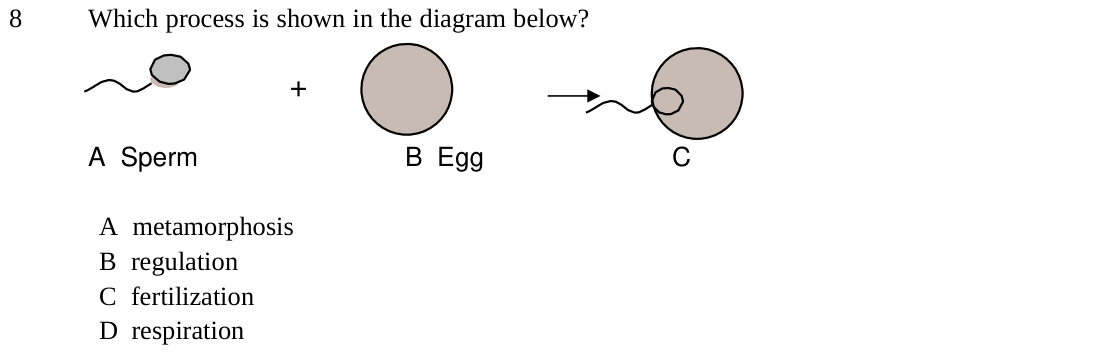
Which process is shown in the diagram below?

Original source panel (all diagram labels and choices preserved):
Question illustration
  1. metamorphosis
  2. regulation
  3. fertilization
  4. respiration

Question 9

Which part of a cell allows nutrients and other materials to enter or leave the cell?

Original source panel (all diagram labels and choices preserved):

Question illustration
  1. cytoplasm
  2. nucleus
  3. chloroplast
  4. cell membrane

Question 10

Which human body system controls production of the hormones that regulate body functions?

Original source panel (all diagram labels and choices preserved):

Question illustration
  1. digestive
  2. endocrine
  3. respiratory
  4. skeletal

Question 11

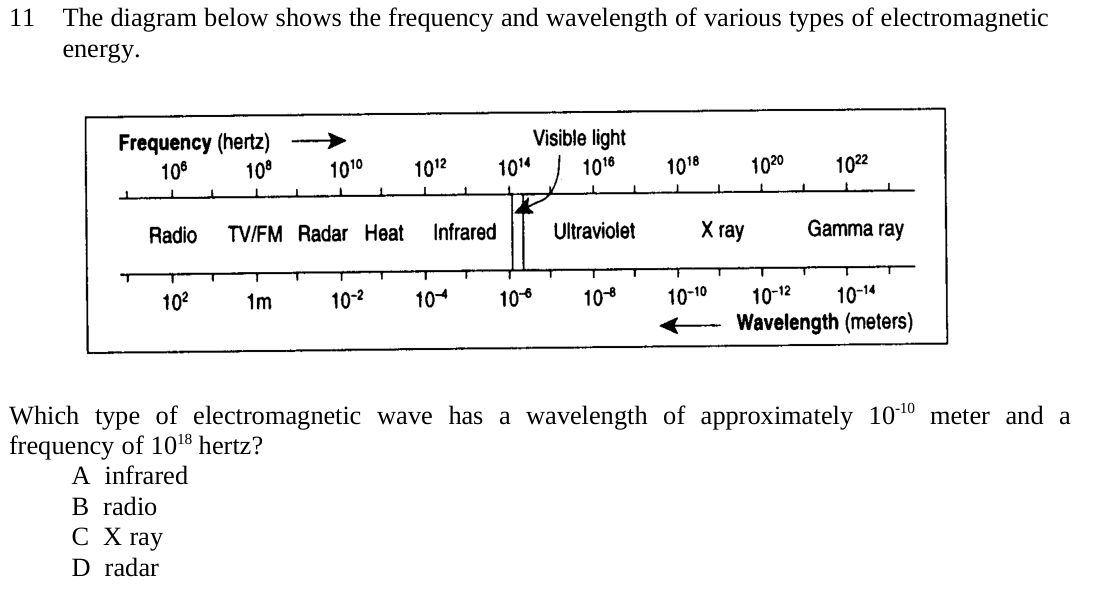
The diagram below shows the frequency and wavelength of various types of electromagnetic energy.

Which type of electromagnetic wave has a wavelength of approximately $10^{-10}$ meter and a frequency of $10^{18}$ hertz?

Original source panel (all diagram labels and choices preserved):
Question illustration
  1. infrared
  2. radio
  3. X ray
  4. radar

Question 12

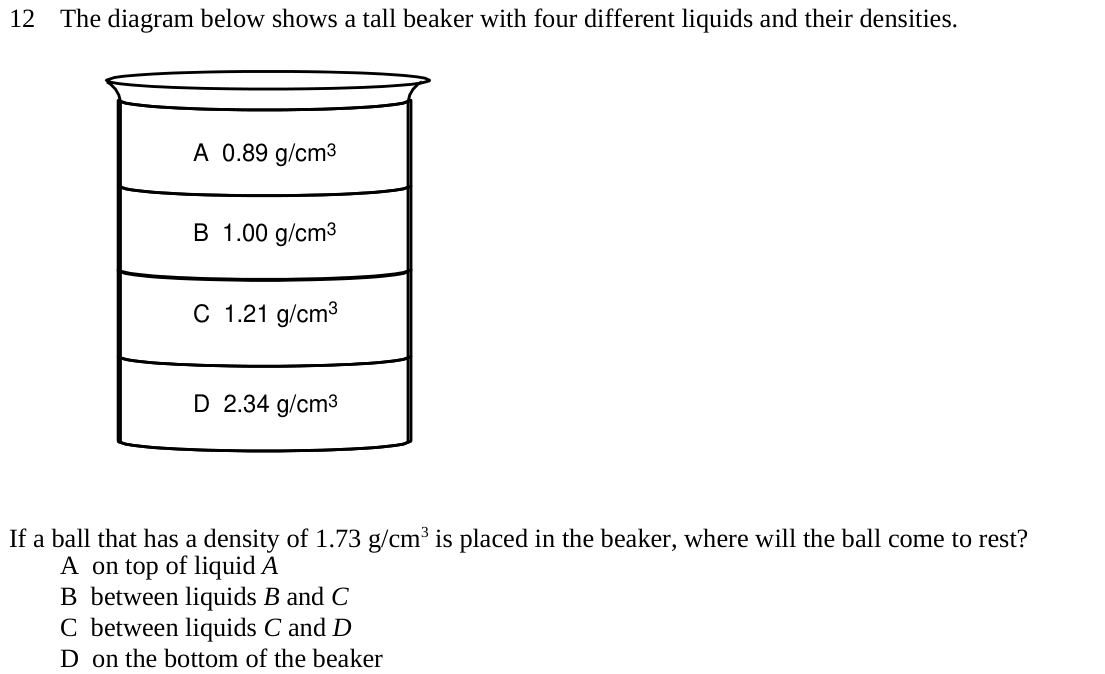
The diagram below shows a tall beaker with four different liquids and their densities.

|Liquid|Density (g/cm³)|
|---|---|
|A|0.89|
|B|1.00|
|C|1.21|
|D|2.34|

If a ball that has a density of 1.73 g/cm³ is placed in the beaker, where will the ball come to rest?

Original source panel (all diagram labels and choices preserved):
Question illustration
  1. on top of liquid A
  2. between liquids B and C
  3. between liquids C and D
  4. on the bottom of the beaker

Question 13

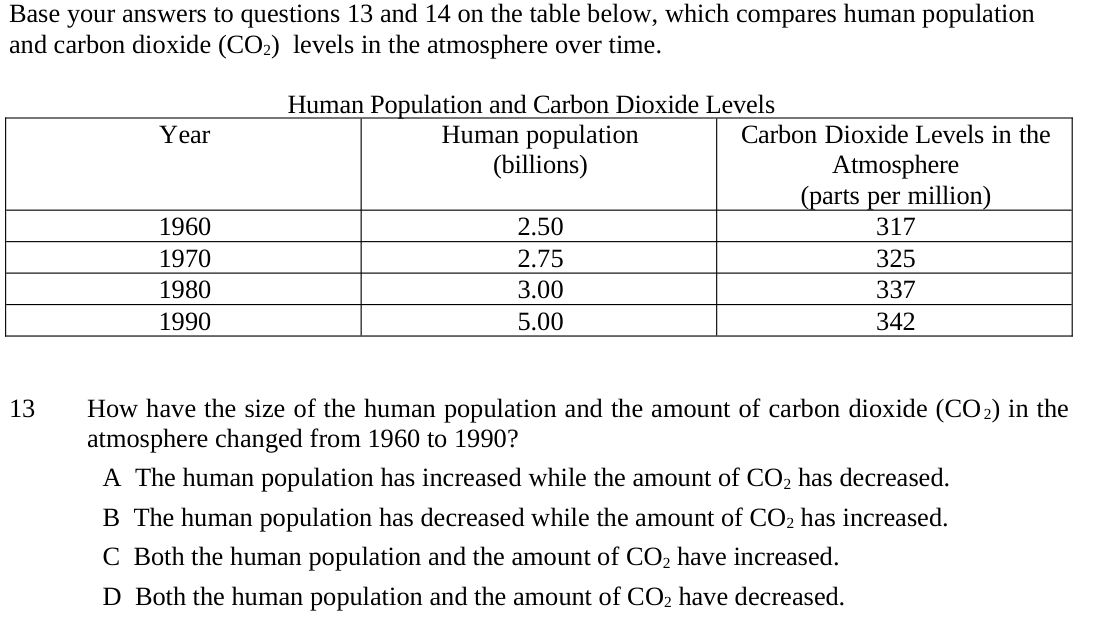
Base your answers to questions 13 and 14 on the table below, which compares human population and carbon dioxide (CO₂) levels in the atmosphere over time.

**Human Population and Carbon Dioxide Levels**

|Year|Human population (billions)|Carbon dioxide in atmosphere (parts per million)|
|---|---|---|
|1960|2.50|317|
|1970|2.75|325|
|1980|3.00|337|
|1990|5.00|342|

How have the size of the human population and the amount of carbon dioxide (CO₂) in the atmosphere changed from 1960 to 1990?

Original source panel (all diagram labels and choices preserved):
Question illustration
  1. The human population has increased while the amount of CO2 has decreased.
  2. The human population has decreased while the amount of CO2 has increased.
  3. Both the human population and the amount of CO2 have increased.
  4. Both the human population and the amount of CO2 have decreased.

Question 14

Base your answers to questions 13 and 14 on the table below, which compares human population and carbon dioxide (CO₂) levels in the atmosphere over time.

**Human Population and Carbon Dioxide Levels**

|Year|Human population (billions)|Carbon dioxide in atmosphere (parts per million)|
|---|---|---|
|1960|2.50|317|
|1970|2.75|325|
|1980|3.00|337|
|1990|5.00|342|

Which human activity might explain the change in carbon dioxide levels shown in the graph?

Original source panel (all diagram labels and choices preserved):

Question illustration

Question illustration
  1. storing nuclear waste
  2. collecting solar energy
  3. using wind energy
  4. burning fossil fuels

Question 15

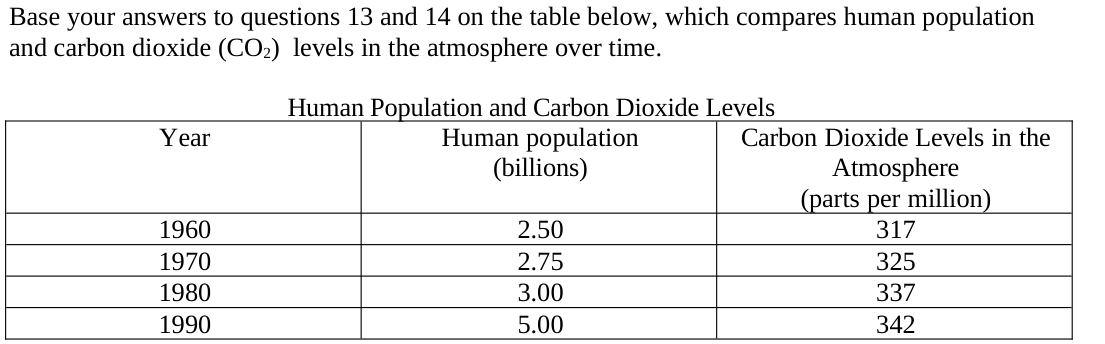
The diagram below shows a cell.

This cell would be found in which type of organism?

A. animals

B. fungi

C. viruses

D. plants

Original source panel (all diagram labels and choices preserved):
Question illustration

Question 16

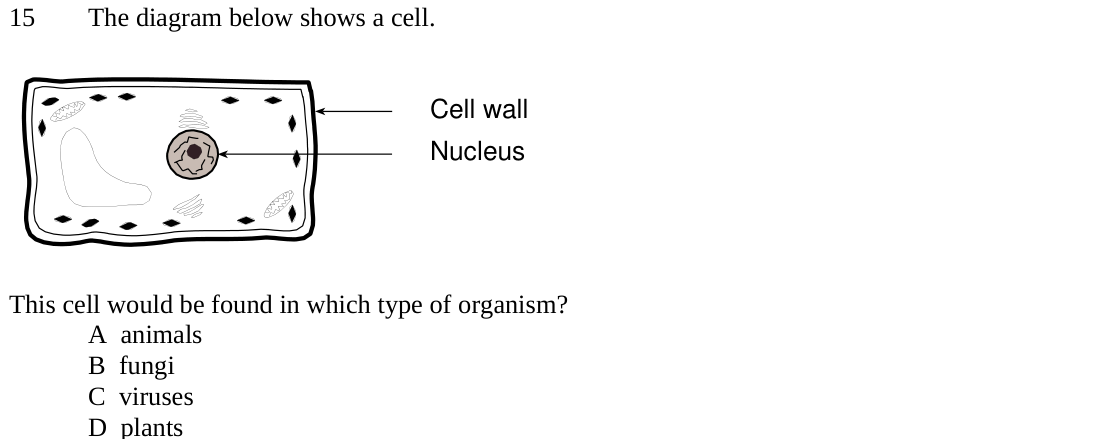
Which graph below shows an object slowing down?

Original source panel (all diagram labels and choices preserved):
Question illustration
  1. Graph A
  2. Graph B
  3. Graph C
  4. Graph D

Question 17

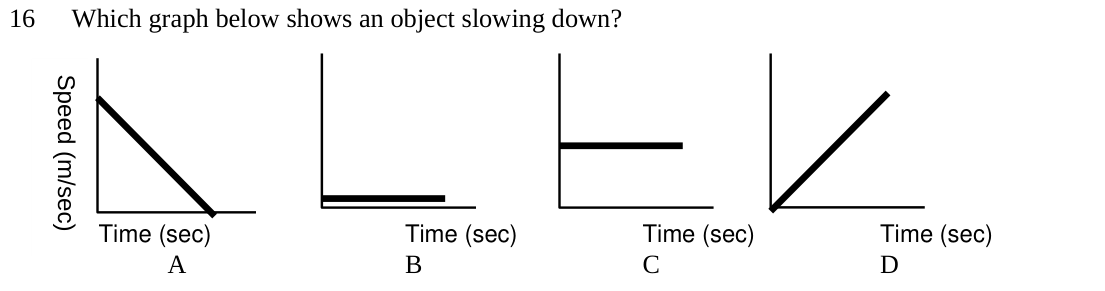
The diagram below shows a model of plant reproduction.

The seeds shown on the plant are produced as a result of

Original source panel (all diagram labels and choices preserved):
Question illustration
  1. ecological succession
  2. hibernation
  3. fertilization
  4. genetic engineering

Question 18

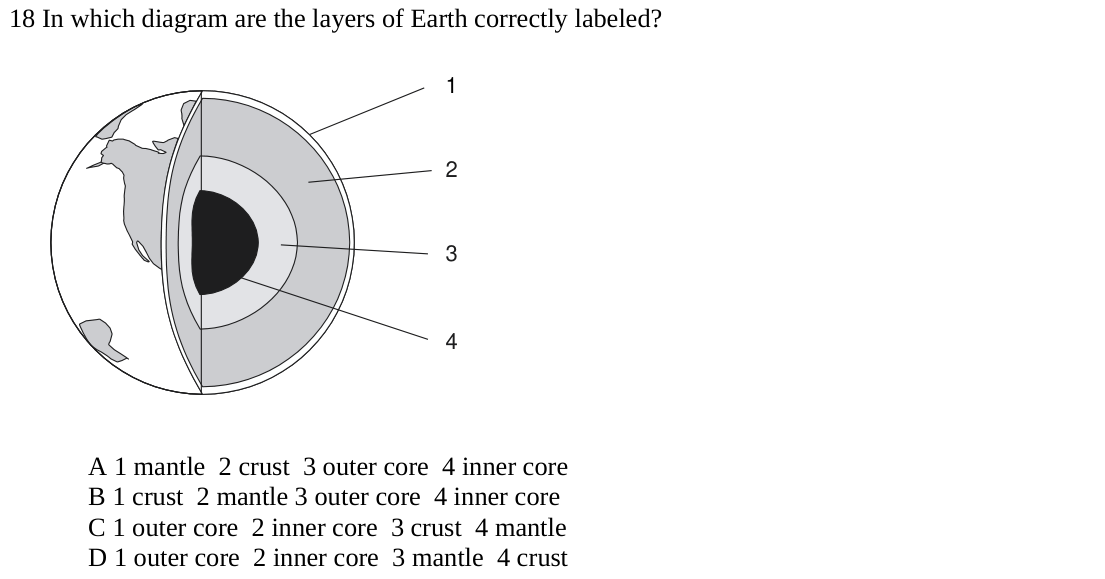
In which diagram are the layers of Earth correctly labeled?

Original source panel (all diagram labels and choices preserved):
Question illustration
  1. 1 mantle; 2 crust; 3 outer core; 4 inner core
  2. 1 crust; 2 mantle; 3 outer core; 4 inner core
  3. 1 outer core; 2 inner core; 3 crust; 4 mantle
  4. 1 outer core; 2 inner core; 3 mantle; 4 crust

Question 19

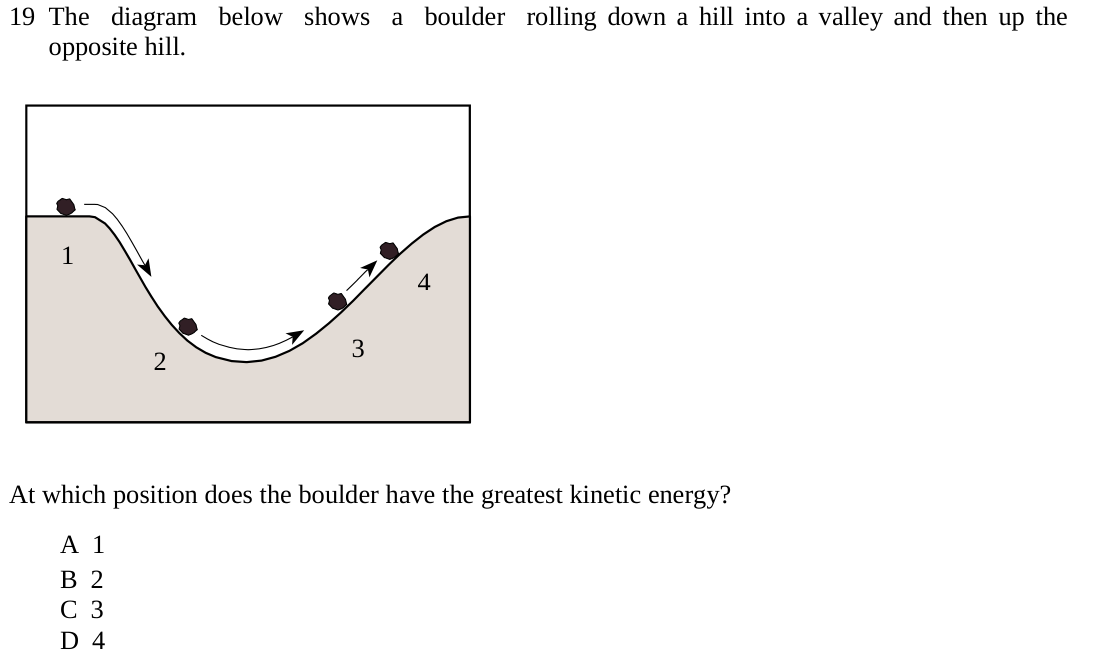
The diagram below shows a boulder rolling down a hill into a valley and then up the opposite hill.

At which position does the boulder have the greatest kinetic energy?

A. 1

B. 2

C. 3

D. 4

Original source panel (all diagram labels and choices preserved):
Question illustration

Question 20

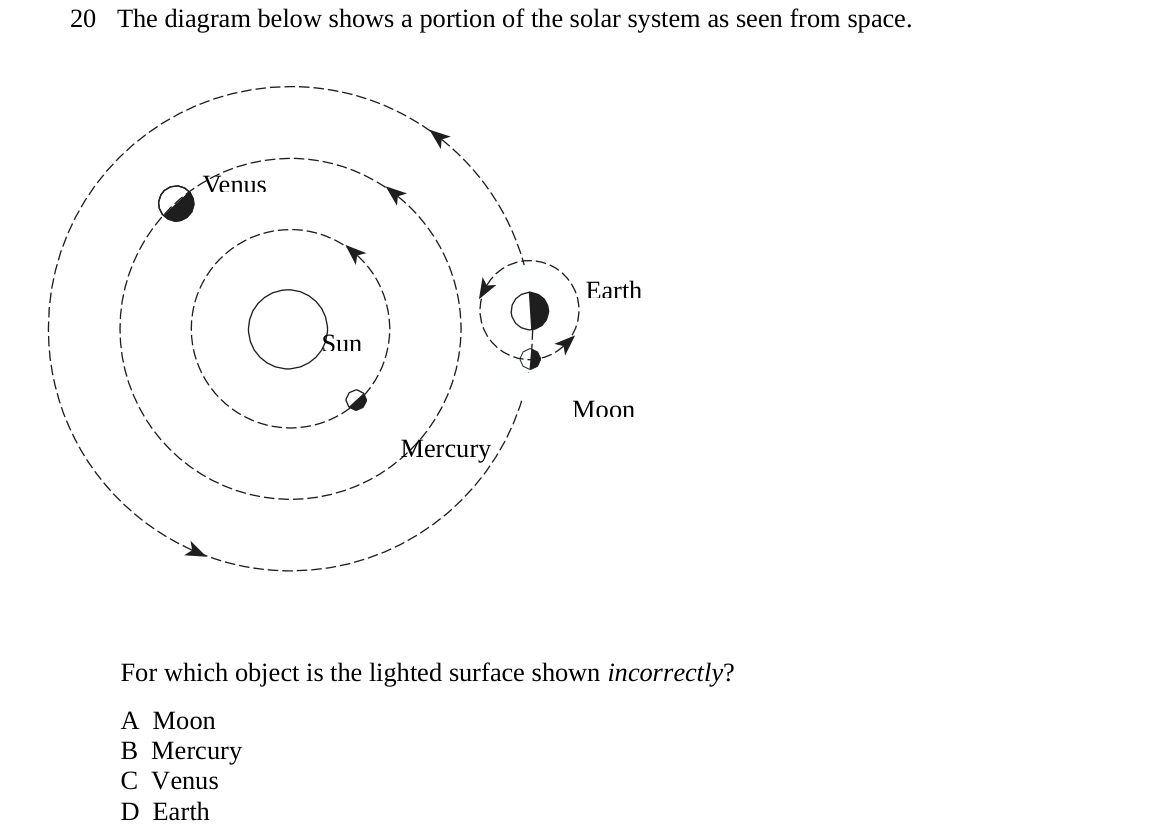
The diagram below shows a portion of the solar system as seen from space.

For which object is the lighted surface shown incorrectly?

Original source panel (all diagram labels and choices preserved):
Question illustration
  1. Moon
  2. Mercury
  3. Venus
  4. Earth