ASMO Science Olympiad 2014 — Division P, Level 2 (Years 5 & 6) Question 25
ASMO Science · ASMO Science Olympiad 2014 — Division P, Level 2 (Years 5 & 6)
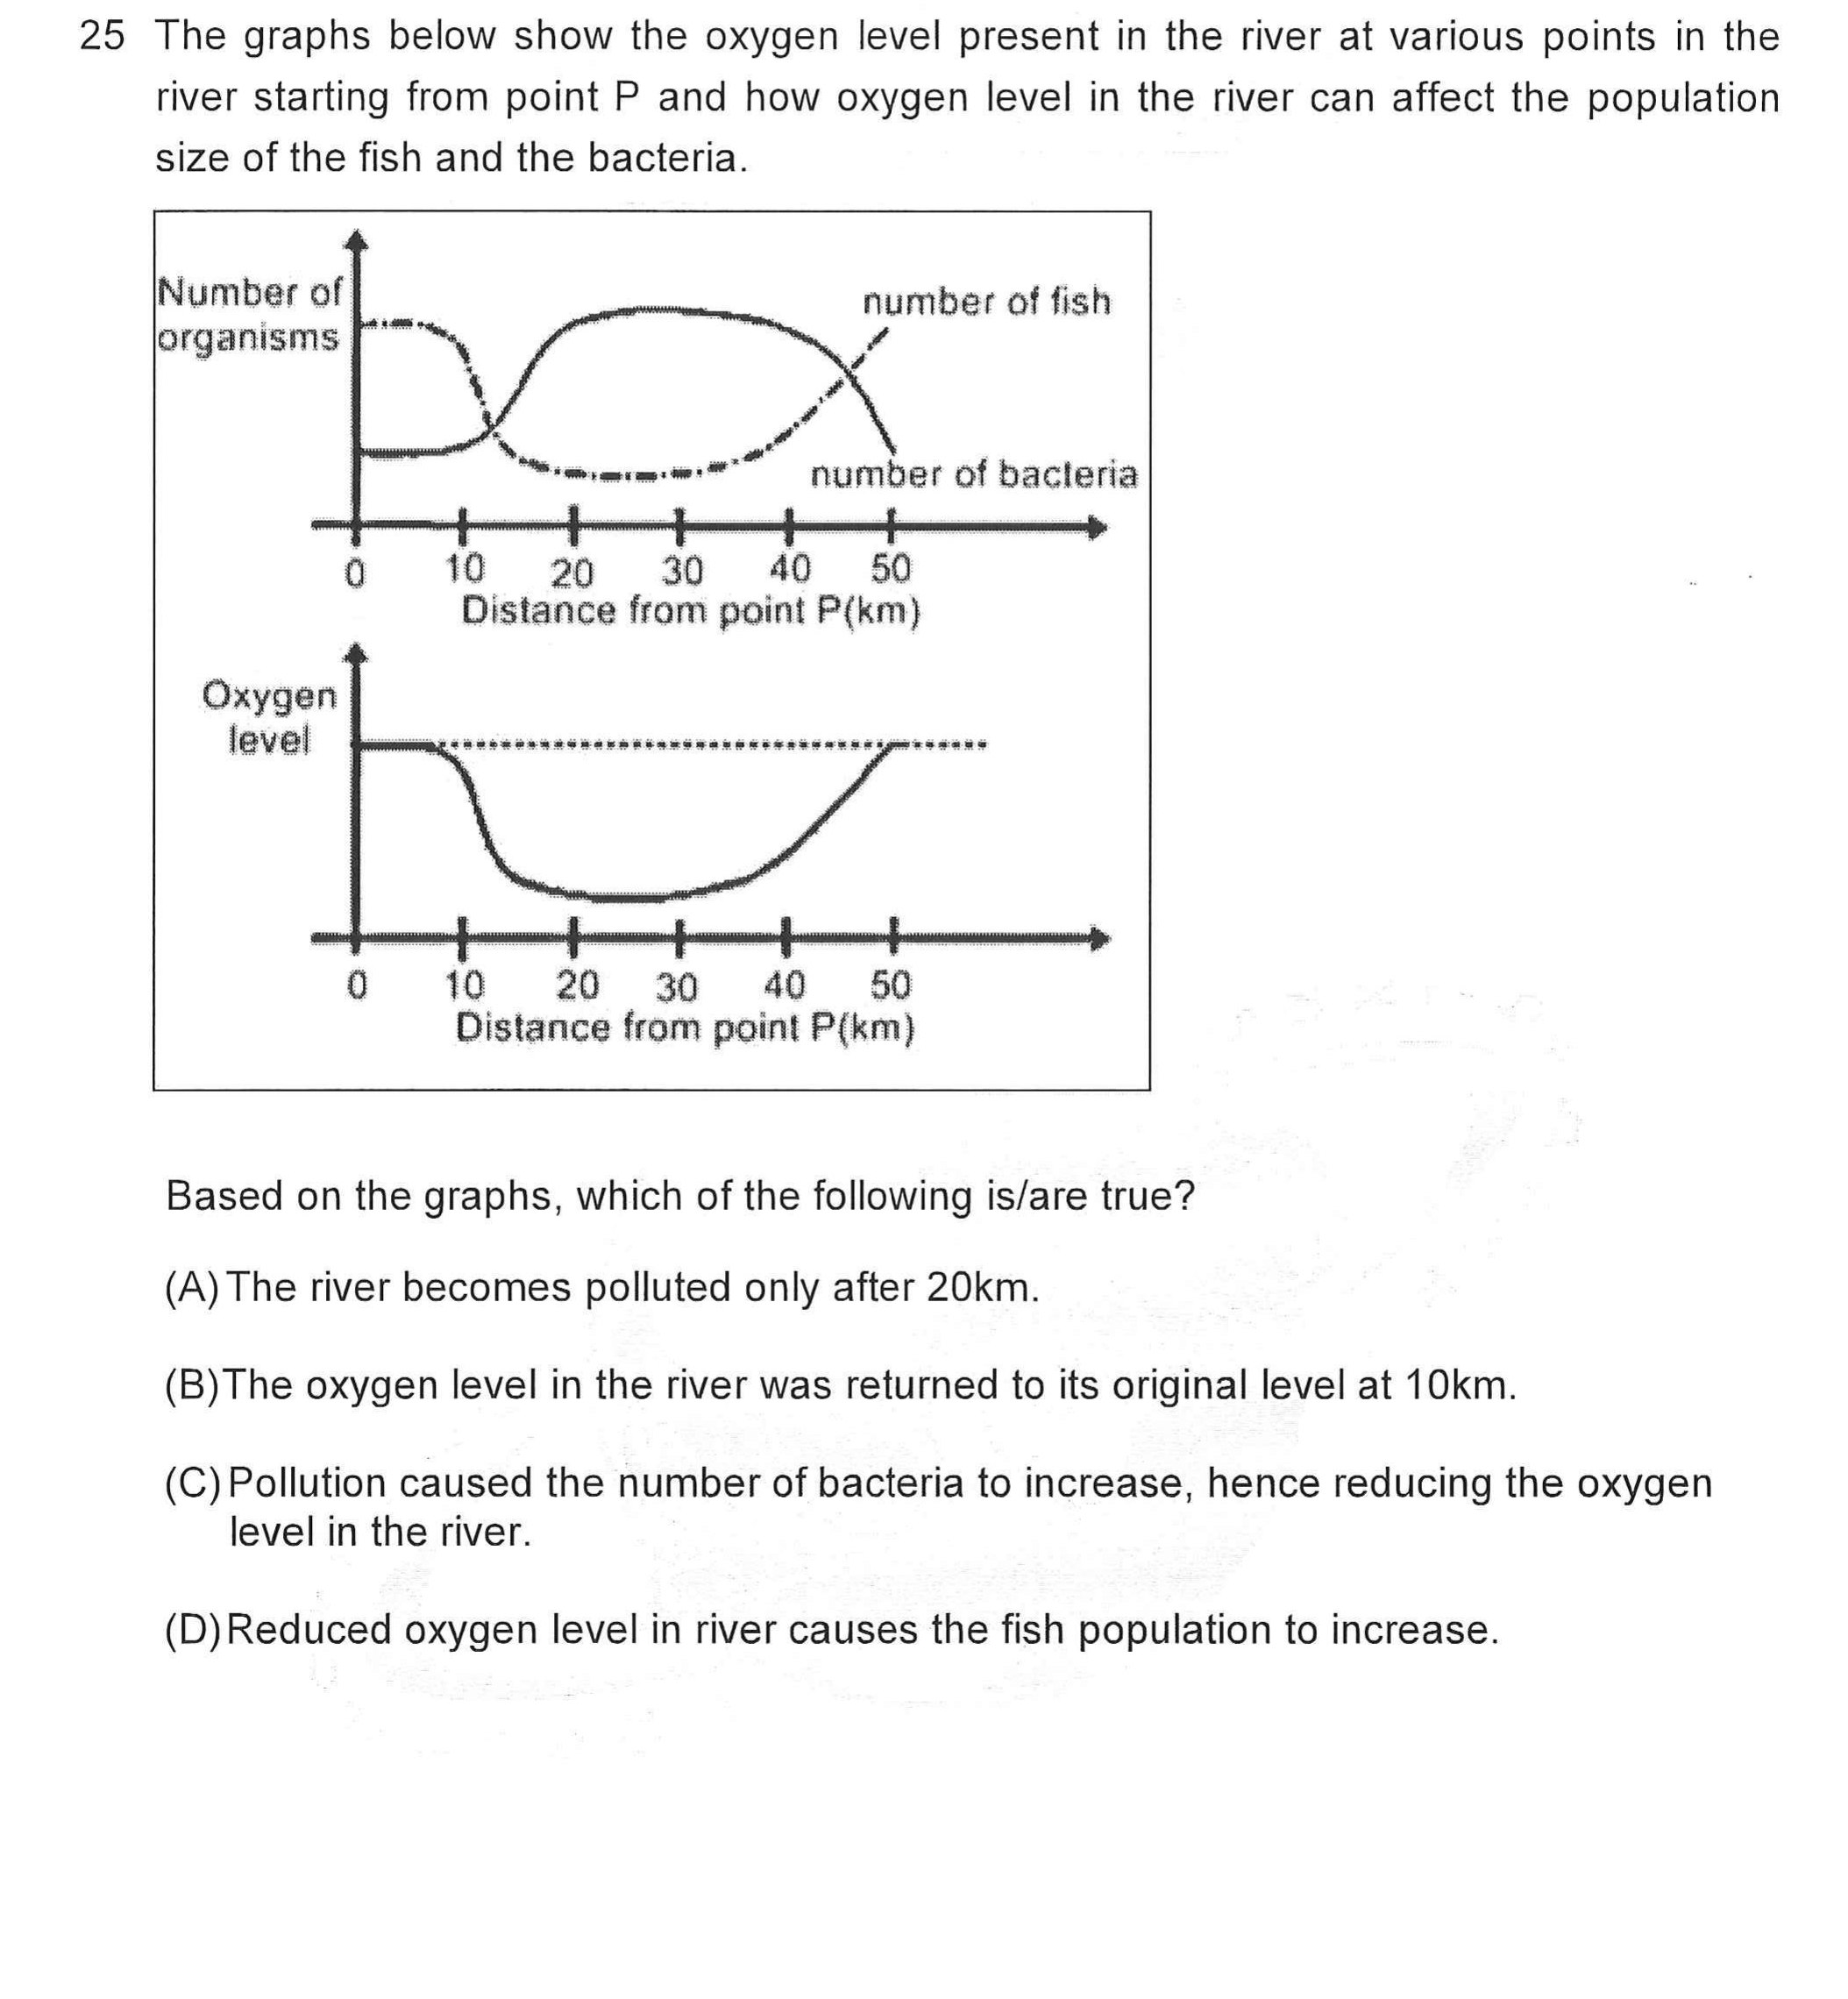
The graphs below show the oxygen level present in the river at various points in the river starting from point P and how oxygen level in the river can affect the population size of the fish and the bacteria.
Based on the graphs, which of the following is/are true?
The river becomes polluted only after 20km.
The oxygen level in the river was returned to its original level at 10km.
Pollution caused the number of bacteria to increase, hence reducing the oxygen level in the river.
Reduced oxygen level in river causes the fish population to increase.