Question 18
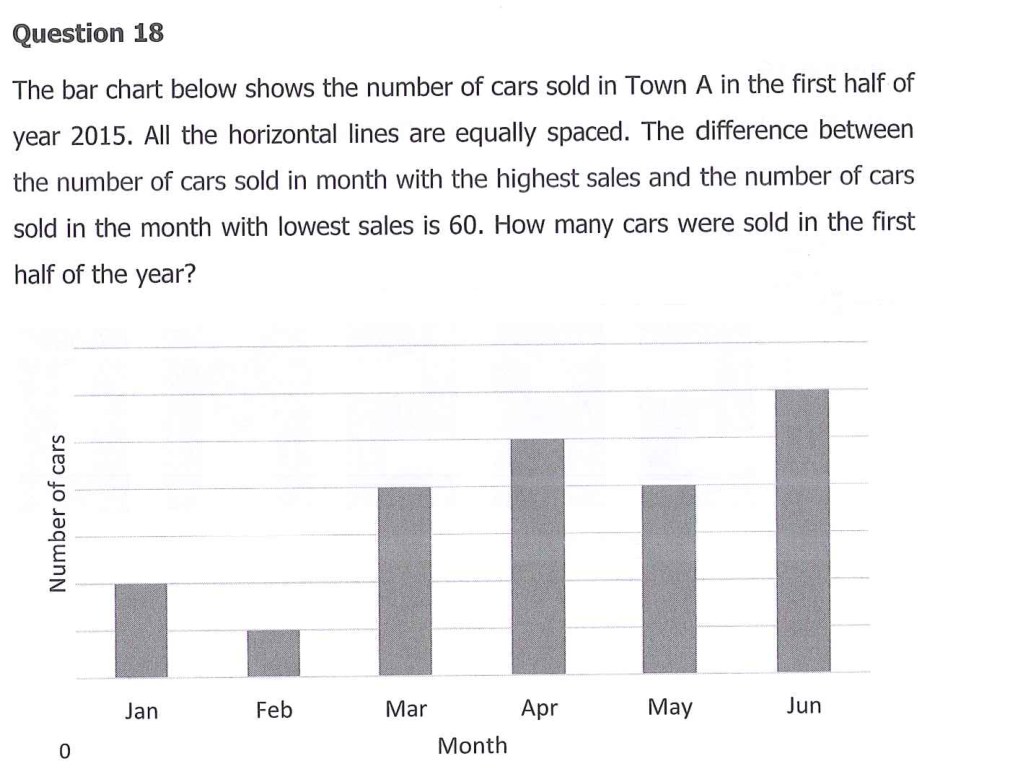
The bar chart shows cars sold in Town A in the first half of 2015. Horizontal lines are equally spaced. The difference between the highest and lowest monthly sales is 60. How many cars were sold in all six months?
SASMO · SASMO 2016 Primary 5 (Grade 5) Contest