Question 20
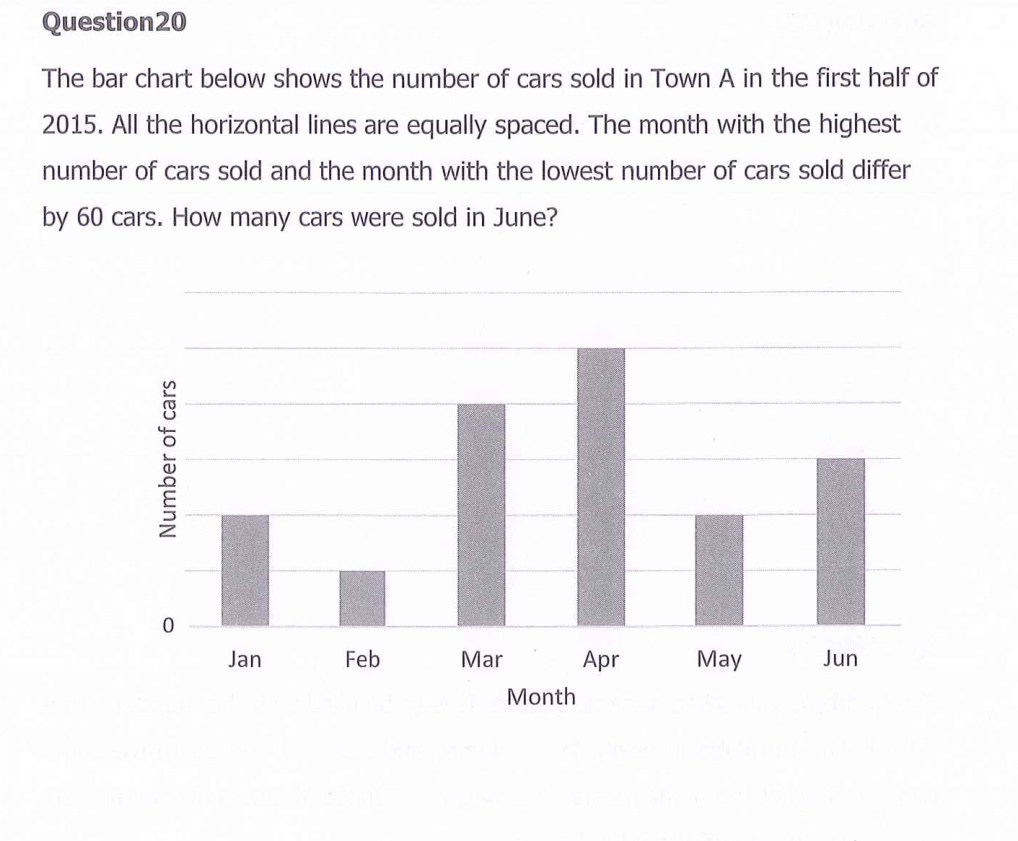
The bar chart shows cars sold in Town A in the first half of 2015. All horizontal lines are equally spaced. The highest and lowest months differ by 60 cars. How many cars were sold in June?
SASMO · SASMO 2016 Primary 4 (Grade 4) Contest