Question 2
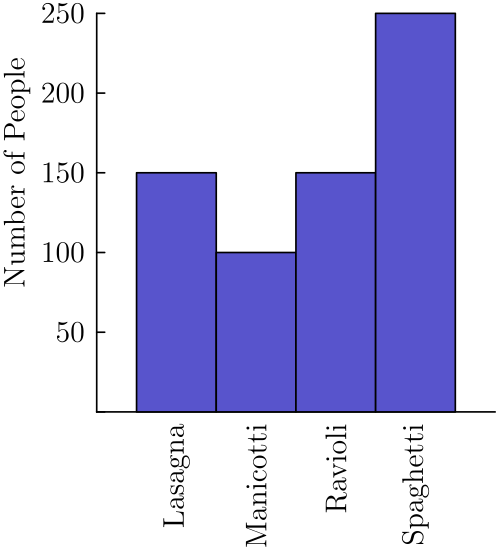
$650$ students were surveyed about their pasta preferences. The choices were lasagna, manicotti, ravioli and spaghetti. The results of the survey are displayed in the bar graph. What is the ratio of the number of students who preferred spaghetti to the number of students who preferred manicotti?