Question 19
The graph shows guests visiting the National Museum in the first six months of 2019. Horizontal lines are equally spaced. The total for January and May is 200 fewer than the June total. How many guests visited in all six months?
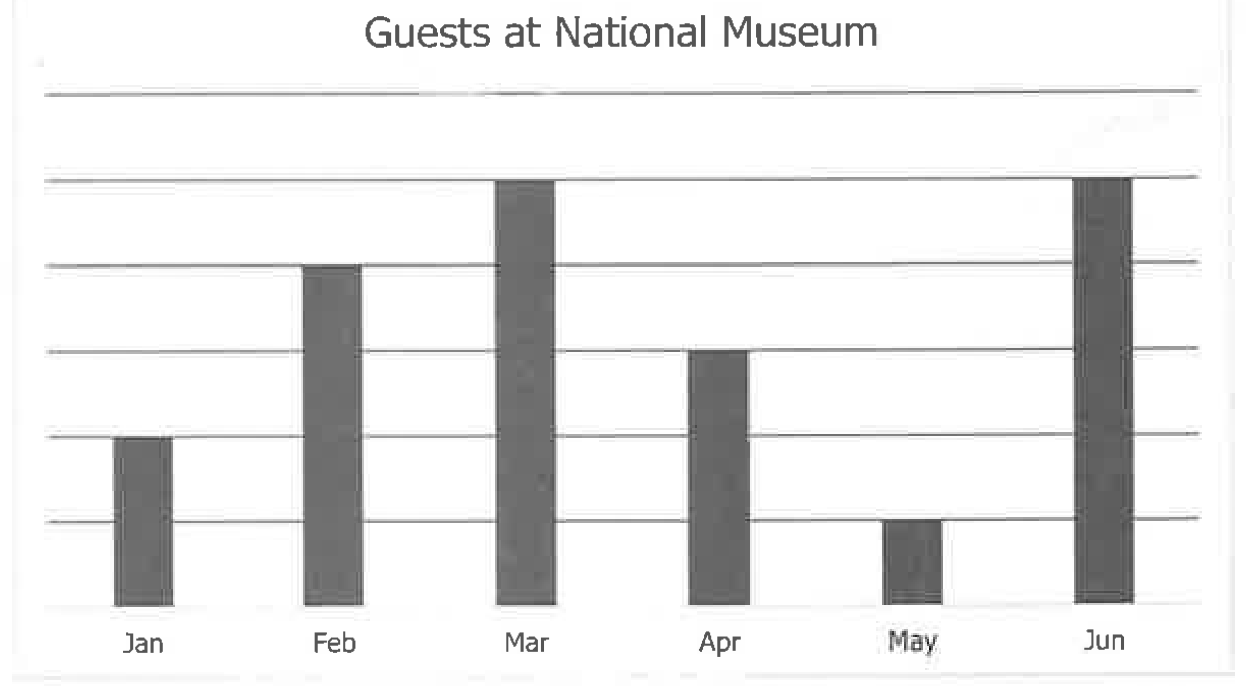
The bottom horizontal line is zero. Source graph labels Jan, Feb, Mar, Apr, May, Jun mean January through June.
Input: enter a whole number without units; leading zeroes from the paper answer grid may be omitted.
The bottom horizontal line is zero. Source graph labels Jan, Feb, Mar, Apr, May, Jun mean January through June.
Input: enter a whole number without units; leading zeroes from the paper answer grid may be omitted.