Question 3
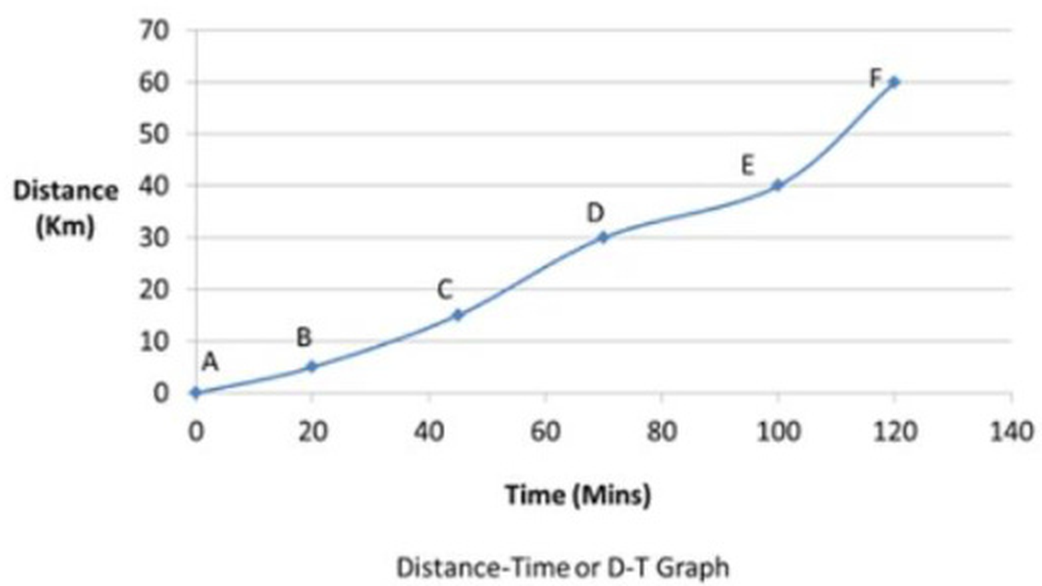
Look at the distance–time graph. Which listed interval has the highest average rate of change of distance? The vertical axis is distance (km); the horizontal axis is time (minutes).
**Input:** Choose one option.
**Input:** Choose one option.