Question 17
An engineer is attempting to have an idea of the roughness of a piece of wood by measuring its coefficient of friction. The table and accompanying graph show measurements of the minimum force needed to push objects of different weights. Given the data, what is the coefficient of friction that the engineer should report?
Normal force (N): 6, 12, 18, 24, 30.
Force applied (N): 2, 7, 11, 13, 18.
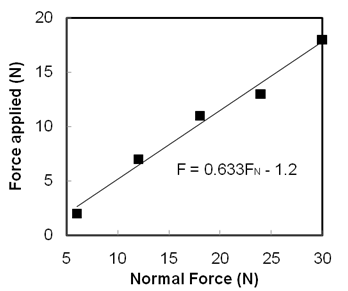
Editorial convention: use the free-intercept regression line explicitly printed in the graph. Graph labels: Applied Force (N); Normal Force (N); F = 0.633Fn − 1.2.
Normal force (N): 6, 12, 18, 24, 30.
Force applied (N): 2, 7, 11, 13, 18.
Editorial convention: use the free-intercept regression line explicitly printed in the graph. Graph labels: Applied Force (N); Normal Force (N); F = 0.633Fn − 1.2.