Question 28
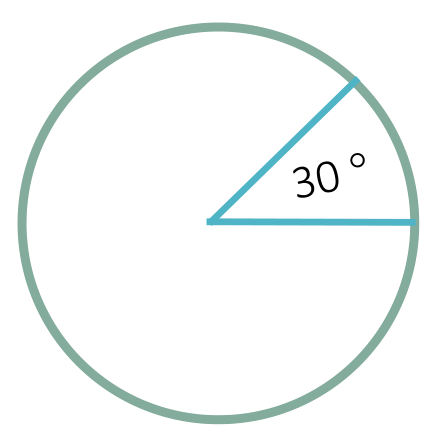
The pie graph below represents the expenses of Johnny for the month of April. He allotted P1, 620 for his total expenses. If the sector represents his expenses on food, how much did he spend for food?
PIMSO Maths · PIMSO 2021 - Mathematics - Grade 4 - National Round Mock Test